Drawdown Explained for Traders: What a Backtest Loss Curve Reveals
Reviewed by the Backtest Editorial Team · Editorial policy
Learn how trading drawdown measures peak-to-trough loss, then inspect depth, duration, recovery, costs, and trade evidence in Backtest.
Quick answer
A drawdown begins when simulated equity moves below its prior high. Percentage drawdown is (current equity − prior peak) ÷ prior peak. Maximum drawdown is the deepest peak-to-subsequent-trough decline in the tested path. A $10,000 curve that peaks at $12,000 and bottoms at $9,000 has a $3,000, or 25%, drawdown—even if it later finishes profitable.
It is not the worst single trade, ordinary price volatility, or a forecast of the maximum future loss. Read depth with the peak, trough, time under water, recovery, trade count, leverage, sizing, costs, and trades that caused the decline.
Research context
CFA Institute’s 2026 Backtesting & Simulation reading frames a backtest as an approximation of the real investment process used to understand risk and return. Rolling windows, scenarios, and sensitivity analysis matter because history contains only some possible conditions.
Magdon-Ismail, Atiya, Pratap, and Abu-Mostafa define maximum drawdown as the largest loss from a peak to a later bottom in their peer-reviewed work available from CaltechAUTHORS and the RPI paper. Test length matters because a longer path offers more opportunities for an extreme decline.
The CFTC hypothetical-system advisory warns that assumed fills were not exposed to real market conditions or a trader’s ability to survive consecutive losses. Investor.gov notes that diversification can reduce concentration but cannot guarantee protection in falling markets.
Backtest setup example
Fix a baseline: BTCUSDT, 1-hour candles, one year, Breakout, long, fixed size, 2% stop loss, 4% take profit, 0.10% commission per fill, and 0.05% slippage. Record provider, dates, timing, leverage, and the intrabar stop-versus-target rule. Backtest simulates trades; it does not place orders.
Save it, then run baseline costs, doubled costs, and half size without changing the signal. Create a controlled XAU/USD, 4-hour, one-year example using the same breakout logic. Normalize size, leverage, horizon, currency, spread, and slippage before comparing the two paths.
How to read the results
Mark the prior equity peak, later trough, and first return to the old peak. Report depth in currency and percentage, duration from peak to trough, and recovery time. If the curve never recovers, label the drawdown open.
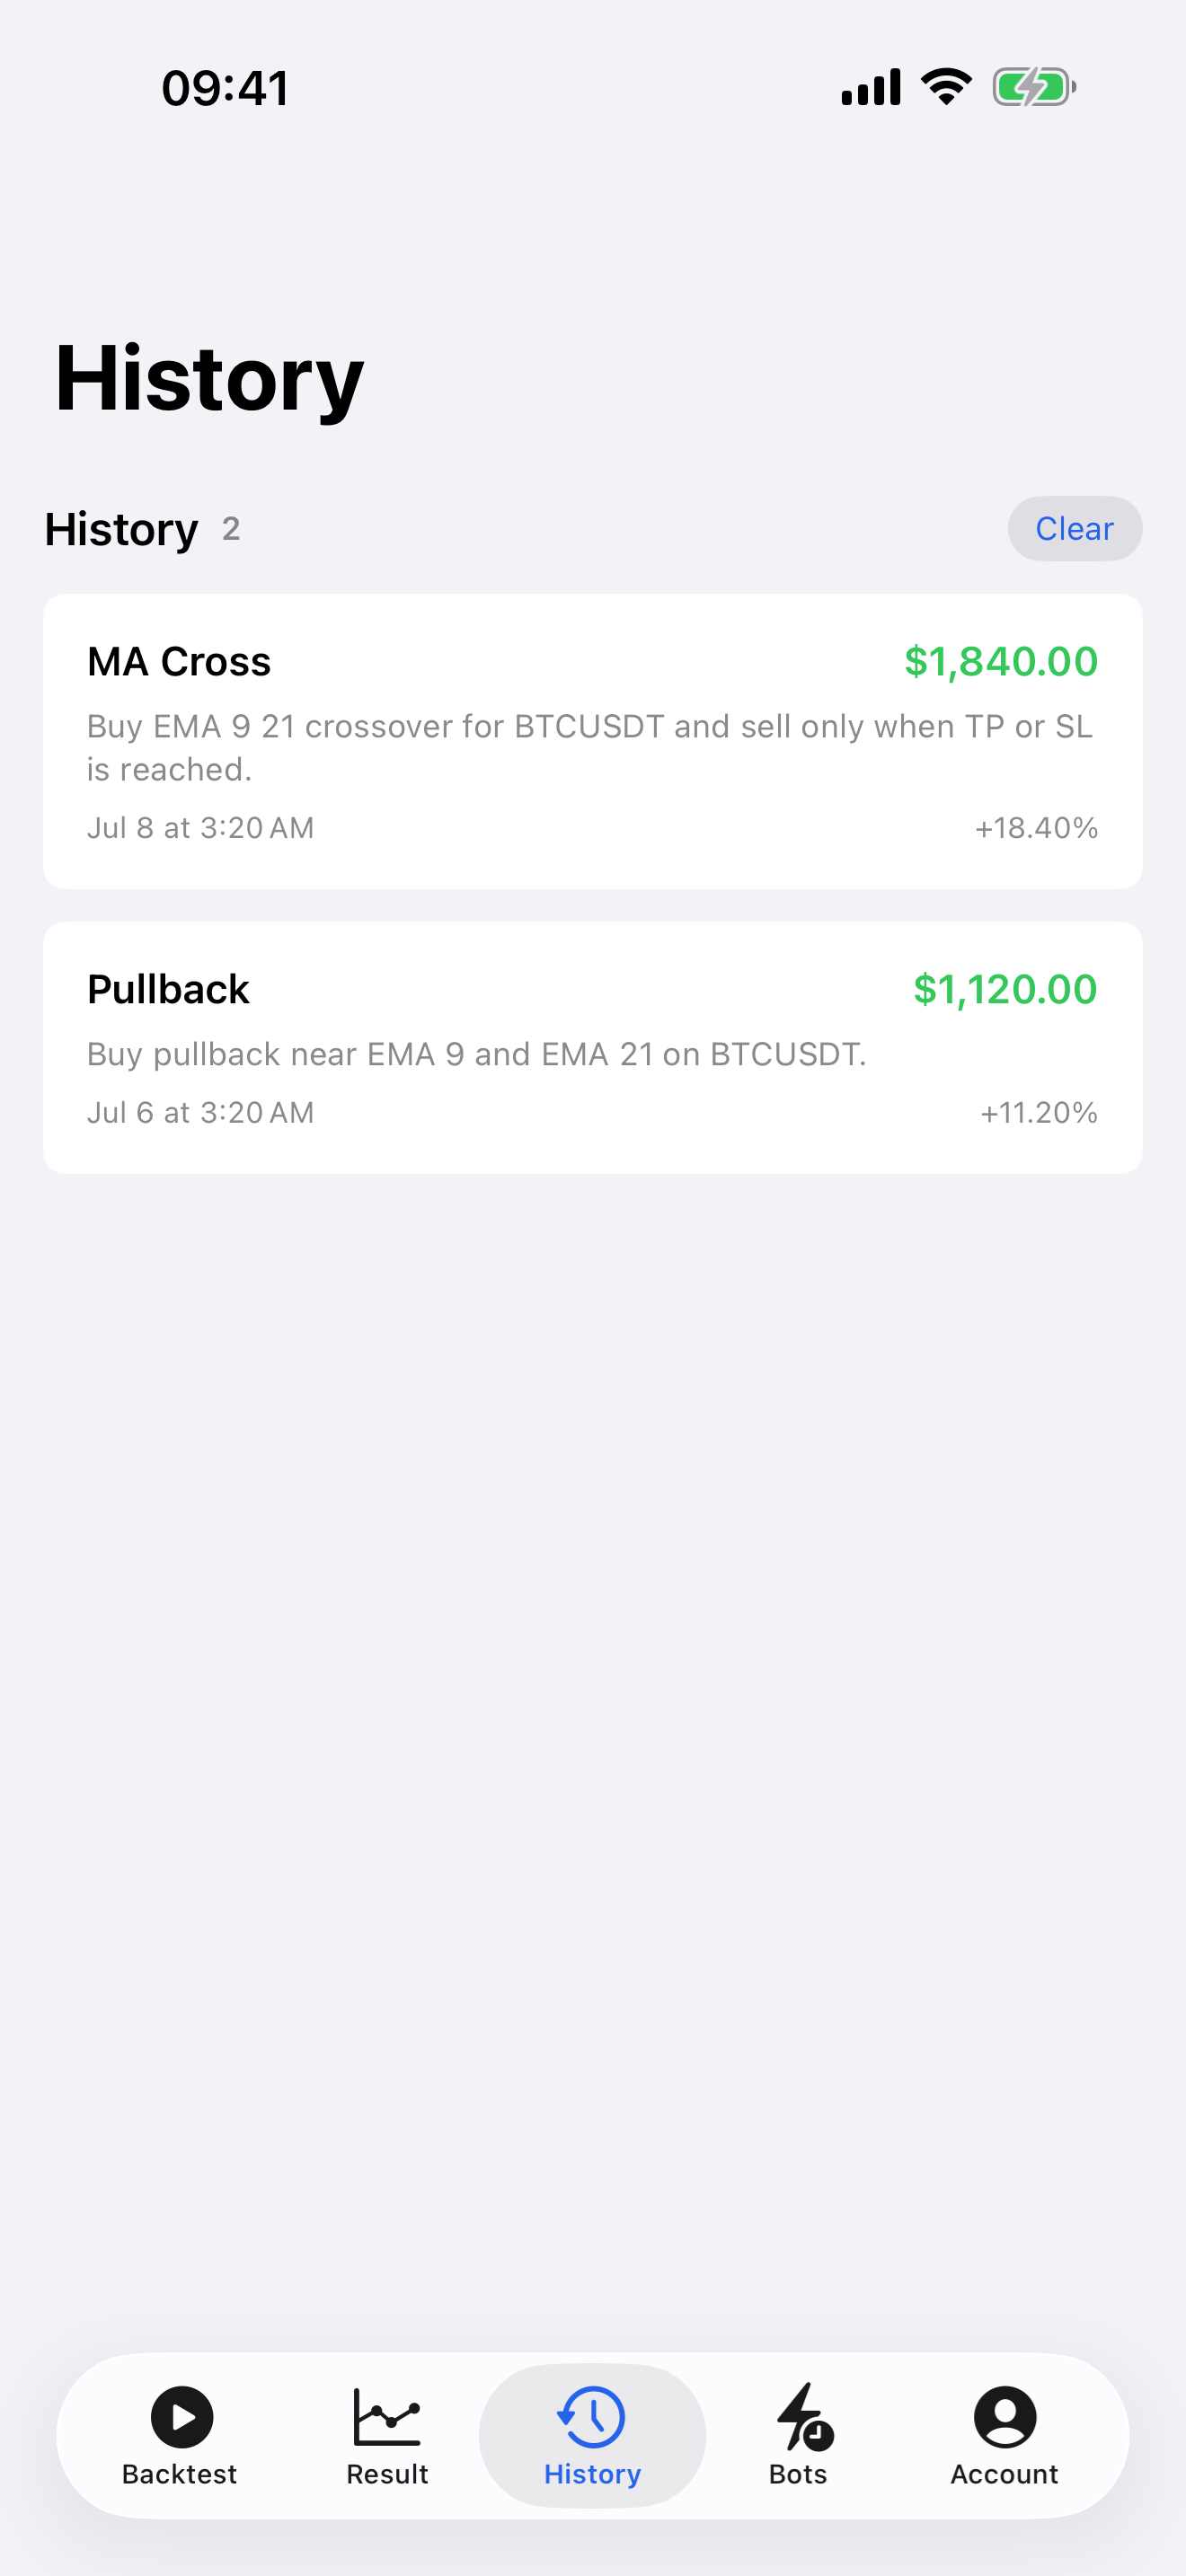
Open trade history and identify every trade in the decline. Was it one gap, many normal losses, costs, overlapping positions, or one regime? Read drawdown beside net result, profit factor, trade count, average and largest loss, exposure, and losing streak. A 12% decline from ordinary losses differs from 12% caused by an impossible fill.
Depth, duration, and recovery
Depth estimates the largest historical decline. Duration shows how long losses continued before the trough. Recovery shows how long it took to regain the peak. A shallow two-year stagnation can be harder to follow than a deeper decline that recovers quickly.
A 25% loss needs a 33.3% gain on reduced capital to recover; a 50% loss needs 100%. This is arithmetic, not a recovery forecast. It explains why leverage can threaten survival before long-run averages matter.
What maximum drawdown cannot tell you
Historical maximum drawdown is one observed extreme, not a hard limit. Candle data can miss intrabar excursions, gaps, liquidation, funding, spread expansion, rejected orders, partial fills, latency, correlated positions, and the number of parameters tried before selecting the curve.
A smaller number is not automatically better: less size reduces currency swings, stale prices can smooth the path, and a short calm sample can omit stress. Compare controlled runs and disclose the horizon.
A drawdown audit protocol
Before testing, declare a research drawdown gate, minimum trades, cost stresses, leverage, and chronological holdout. Save the baseline inputs and build a ledger for the three largest declines: peak/trough values and dates, depth, duration, recovery, trades, costs, exposure, and regime.
Then change one assumption at a time: double plausible costs, delay entry one bar, worsen stop fills, vary one neighboring parameter, and split trend, range, calm, and volatile segments. Test the frozen rule on untouched later data. A failed gate belongs in the archive, not in another tuning loop on the holdout.
Comparing BTCUSDT and XAU/USD fairly
Use matched risk per trade, comparable leverage, normalized percentage equity, the same horizon, and explicit friction. Crypto trades continuously; gold liquidity and gaps vary around sessions and closures. These structural differences belong in the interpretation.
Do not call the asset with the smaller observed drawdown universally safer. Ask where losses cluster, whether one direction dominates, and whether cost stress changes the ranking.
Separate path risk from one headline return
Two tests can finish with the same net result while exposing the trader to very different journeys. One curve may rise steadily and suffer several short declines; another may spend most of the year below its prior peak before one late winner repairs the total. The final return compresses those paths into one number. Drawdown restores the sequence: when capital was impaired, how deeply, for how long, and which assumptions produced the recovery.
Check concentration before interpreting the headline. Recalculate the result without the largest winning trade and without the strongest month. This is not a prediction or a reason to delete valid observations. It is a sensitivity test for dependence on an outlier. If removing one event changes a profitable curve into a long unresolved drawdown, report that dependence beside the original result.
Record open drawdowns honestly
A test that ends below its previous peak has no observed recovery date. Report the peak date, the lowest subsequent point, the drawdown at the end of the sample, and the elapsed time under water. Extending the chart only until the strategy recovers would introduce selection bias, while pretending that the trough is final may understate a decline that was still developing.
Repeat the measurement on fixed calendar windows and on an untouched later period. Keep the same signal, sizing, fees, slippage, and intrabar assumptions. The purpose is not to find a window with a prettier curve; it is to see whether depth and duration remain tolerable when the market regime changes. A research gate should be written before the holdout is opened, and a failed result should remain part of the evidence.
Common mistakes
- Calling the largest losing trade maximum drawdown.
- Measuring from starting capital instead of the latest peak.
- Hiding duration, leverage, recovery, or an open drawdown.
- Comparing different horizons, sizes, currencies, or costs.
- Ignoring spread, slippage, funding, gaps, and liquidation.
- Optimizing for the smallest drawdown on the evaluation sample.
Practical checklist
- Freeze market, dates, timeframe, rules, direction, size, leverage, costs, stop, and target.
- Mark every peak, trough, recovery, and open drawdown.
- Report currency and percentage depth, duration, and recovery.
- Trace the three largest declines to exact simulated trades.
- Read drawdown with result, profit factor, trades, exposure, and outliers.
- Stress costs and worse fills one variable at a time.
- Use untouched later data, keep failures, and observe paper signals next.
Risk note
Backtest is an education and strategy-research tool, not financial advice, a broker, exchange, or execution service. Historical results do not guarantee future performance. Past maximum drawdown is not a maximum possible future loss. Real liquidity, spread, slippage, fees, funding, gaps, latency, liquidation, and fills can differ materially. Leverage magnifies losses. Never risk capital you cannot afford to lose.
Related guides
Backtest Trading for iOS
Continue research in Backtest
Inspect drawdown, costs, and simulated trade evidence on iPhone.
Download on the App Store