XAU/USD Strategy Tester: Test Gold Rules and Costs
Reviewed by the Backtest Editorial Team · Updated September 3, 2026 · Editorial policy
Test XAU/USD gold strategies with a clear setup, stop loss, take profit, and slippage checks. See a worked cost example and review every simulated trade.
Quick answer
An XAU/USD strategy tester applies fixed trading rules to historical gold candles and reports simulated entries, exits, costs, and drawdown. To compare gold strategies fairly, keep the symbol, dates, timeframe, position size, and costs unchanged; test a breakout and a pullback as separate hypotheses. This guide uses a three-month, 1-hour research setup and shows what slippage measured in basis points means. Start with the XAU/USD backtesting overview if you need the basic workflow. Backtest does not place real trades, and a profitable historical result does not predict future returns.
Research context
Backtesting asks how fixed rules would have behaved in a historical environment; it cannot recreate every future state. CFA Institute guidance pairs chronological testing with rolling evaluation, sensitivity analysis, scenario analysis, and careful control of look-ahead and survivorship bias. For this topic, the central failure mode is concrete: Gold reacts to macro news and can move through a stop trigger before an assumed fill. That is why a single optimized parameter or attractive chart is weak evidence. Bailey and co-authors show that selecting a winner from many trials raises the probability of backtest overfitting. Keep a trial log, count rejected configurations, and reserve unseen data. Trading costs also reduce returns, and frequent rules experience that penalty repeatedly. Backtest-specific analysis therefore starts from a cost-aware baseline and asks whether the conclusion survives plausible neighboring assumptions rather than whether one run is profitable.
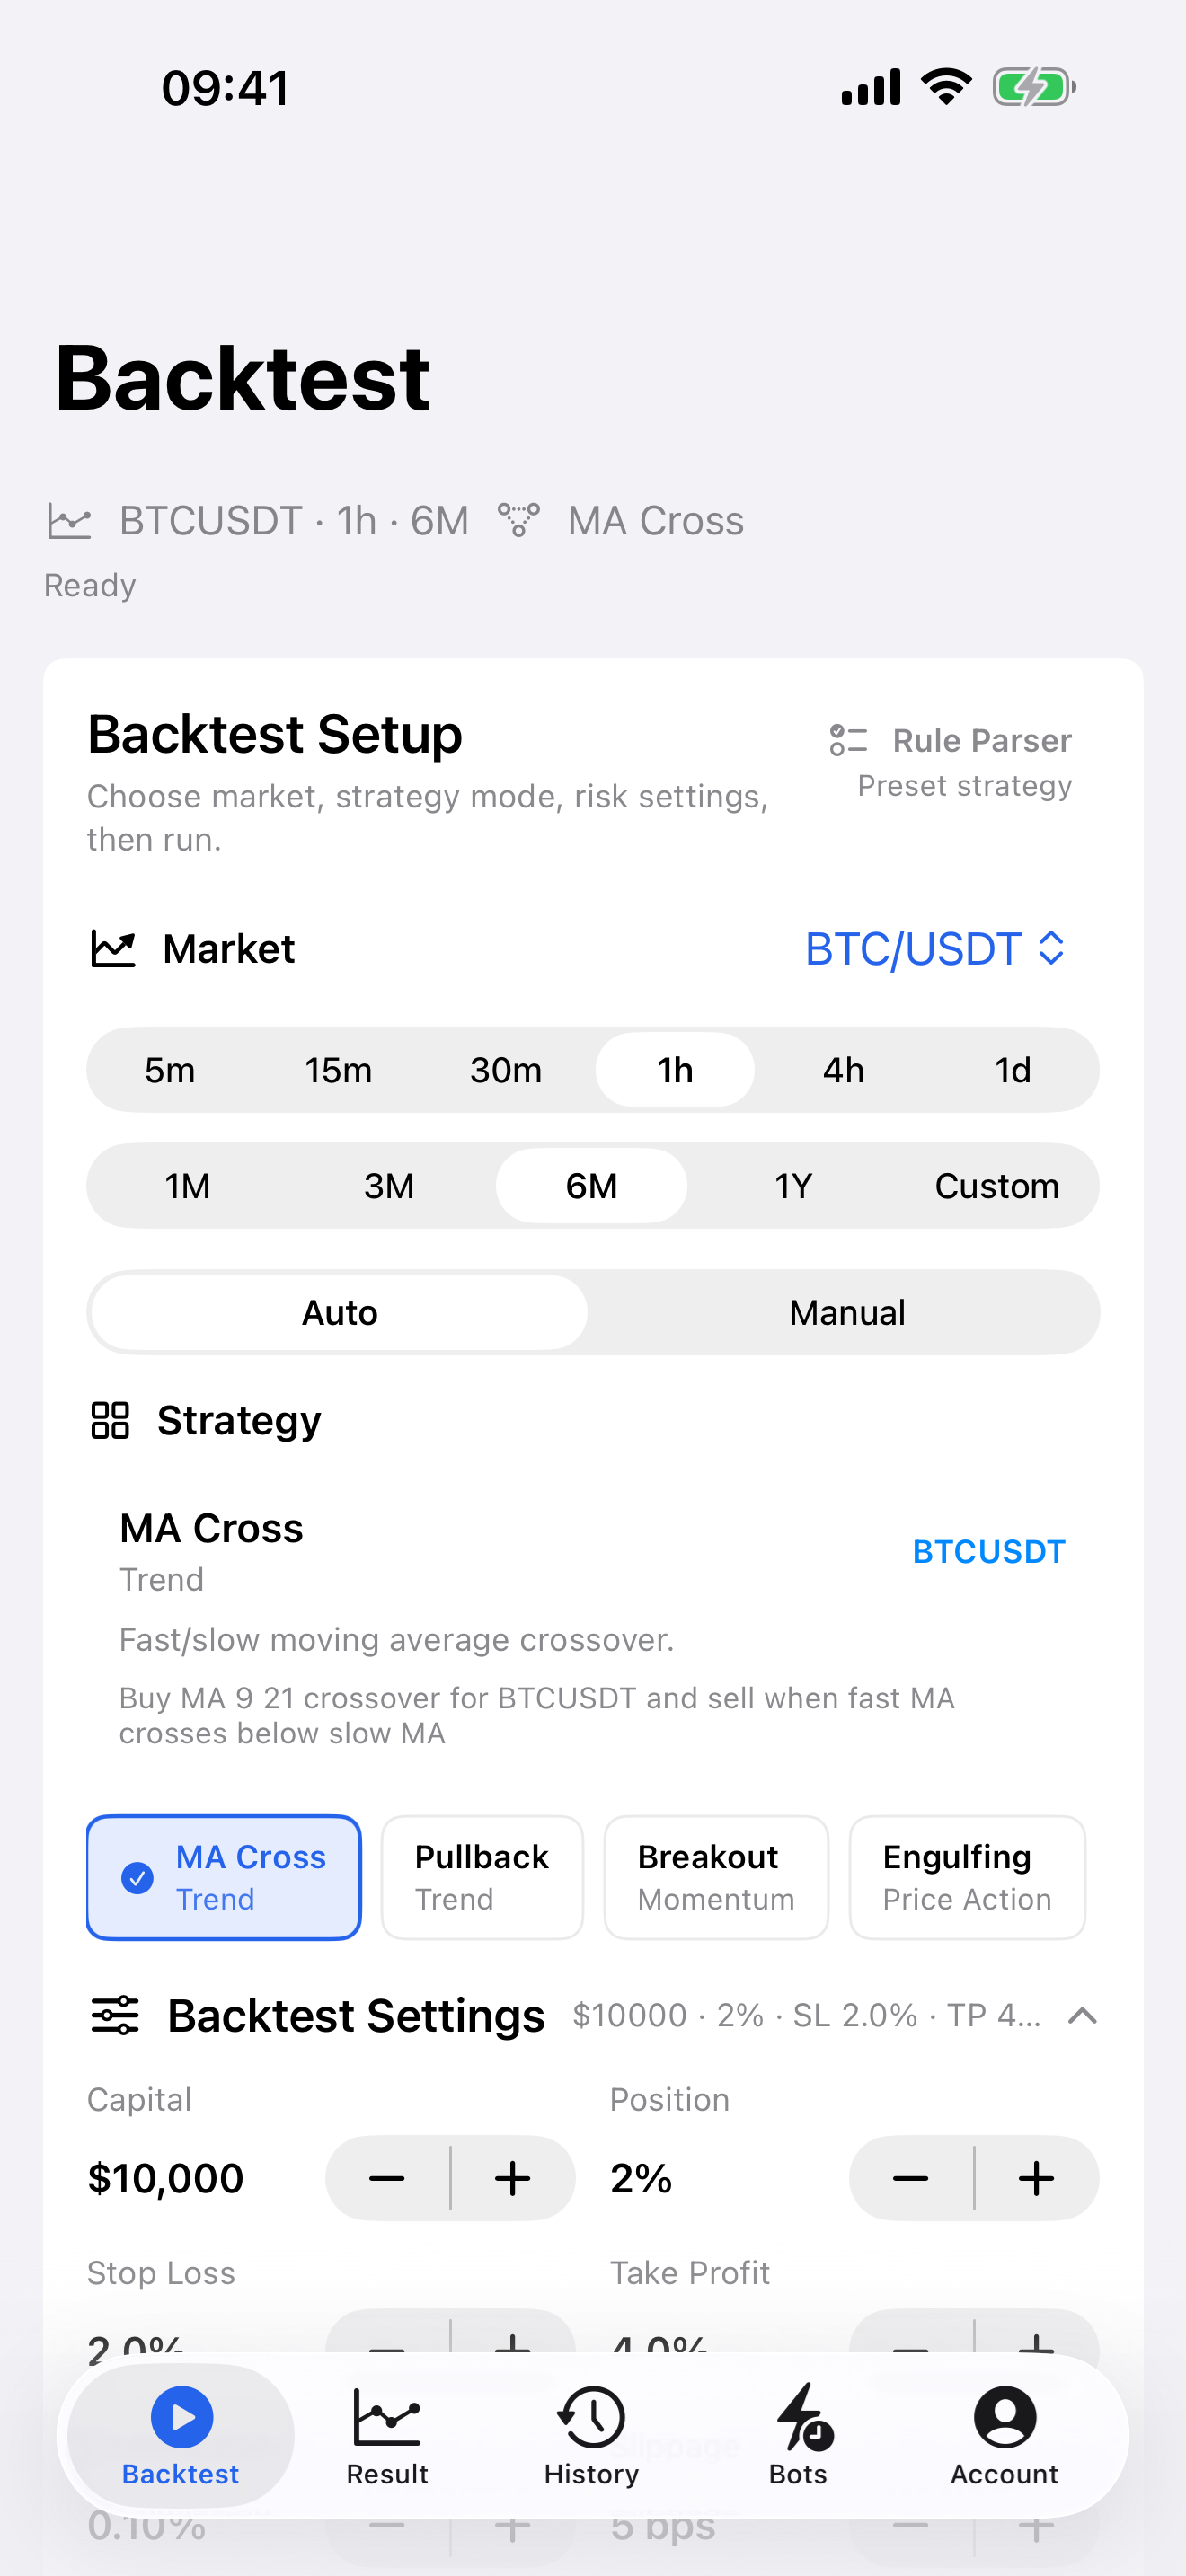
Backtest app setup example
Use this reproducible starting point: XAU/USD, 1h, 3M, Breakout or Pullback, both directions. Confirm that the displayed symbol and provider match the intended market. Set direction deliberately; a both-direction test combines two hypotheses that should also be inspected separately. Enter commission and slippage per fill, choose signal-and-risk or risk-only exits consciously, and record the exact date range. Run the baseline once, save it, and then create named variants. Separate breakout and pullback hypotheses; compare 1%, 2%, and 3% stops without mixing rules. Change only one family of assumptions at a time. The app provides historical candles, simulated trades, chart markers, summary metrics, and history review; it does not model a complete order book or place live orders.
How to read the results
First, reconfirm every input before reading performance. Then pair net result with trade count and market exposure. A high win rate from a small sample can be noise, while a lower win rate can still coexist with positive expectancy if average wins exceed average losses after costs. Read profit factor beside the largest winner so one outlier cannot hide fragility. Study maximum drawdown as a path: depth, duration, recovery, and the cluster of trades that caused it. The topic-specific emphasis here is tail losses, stop slippage sensitivity, and concentration around news-like bars. Open trade history and inspect the largest gain, largest loss, ordinary trades, and the worst losing streak. Check whether an entry uses information available at that moment and whether a long candle makes stop-versus-target order ambiguous. Finally, freeze the rule before the holdout; changing it after seeing holdout results consumes that evidence.
Worked gold example: slippage in basis points
Slippage is entered in basis points: 1 bp is 0.01%, so 5 bps is 0.05%. At a hypothetical gold quote of $2,000, the table shows the adverse price adjustment for one fill. These round numbers explain the calculation; they are not current gold prices, a measured backtest result, or recommended settings.
| Slippage per fill | Price adjustment | Long entry price |
|---|---|---|
| 5 bps (0.05%) | $1 | $2,001 |
| 10 bps (0.10%) | $2 | $2,002 |
| 20 bps (0.20%) | $4 | $2,004 |
A simulated long entry moves upward with adverse slippage; a long exit moves downward from its quoted price. Commission is a separate cost on each side. Keep the signal and date range fixed when comparing these assumptions. Inspect which trades change, then compare net result, profit factor, and drawdown. A fixed per-fill assumption cannot reproduce every spread change or market gap. Use the cost and slippage calculator to check the arithmetic, then inspect the actual assumptions and fills in the result.
Data and execution limits
The historical candle is an observation, not a guaranteed executable quote. It compresses the path inside the bar and may omit order-book depth, queue priority, partial fills, latency, spread variation, rejected orders, funding, rollover, and venue outages. Those omissions matter differently for every market and rule. Gold reacts to macro news and can move through a stop trigger before an assumed fill. Use the same data source for controlled comparisons, note missing or duplicated bars, and avoid treating a provider symbol as interchangeable with every venue. When a stop and target could both be touched inside one candle, document the simulator's ordering assumption and test a less favorable case. Cost stress is a practical proxy, not a complete execution model.
Backtest-specific decision rule
Decide what would falsify the idea before reviewing the run. For this guide, the most useful evidence is tail losses, stop slippage sensitivity, and concentration around news-like bars. Define a minimum sample requirement, an acceptable cost-stress response, and a drawdown boundary that would end further research. These are research gates, not promises of safety. If the baseline fails, keep it in the log and do not quietly replace the hypothesis. If it passes, advance only the unchanged rule to a later holdout and paper observation. This staged process makes Backtest a falsification tool: each step should be able to reject the strategy, while no single historical result is allowed to approve real-money trading.
How to compare variants fairly
Use a comparison table with one row per named run and columns for the changed assumption, net result, trade count, profit factor, maximum drawdown, average trade, largest winner, and worst losing streak. Keep unchanged inputs visible so an accidental timeframe or direction change cannot masquerade as improvement. Rank nothing until costs and sample size are shown. Separate breakout and pullback hypotheses; compare 1%, 2%, and 3% stops without mixing rules. The objective is not to declare a universal winner; it is to learn which conclusion is stable, which trade-off changed, and which result should be rejected. Save screenshots and timestamps for the baseline and holdout so later research can reproduce the decision.
Common mistakes
Common mistakes include choosing thresholds after looking at the chart; using zero commission, spread, or slippage; changing several settings together; reporting return without drawdown and sample size; treating OHLC candles as tick-by-tick execution; assuming a stop price is a guaranteed fill; ignoring rejected trials; repeatedly consulting the holdout; and confusing paper signals with brokerage execution. Another error is semantic: an indicator condition, breakout label, pullback shape, stop distance, or target distance is not a strategy until its timing, direction, exits, sizing, and costs are explicit.
Practical checklist
- State the hypothesis in one falsifiable sentence
- Record XAU/USD, 1h, 3M, Breakout or Pullback, both directions
- Confirm symbol, provider, timeframe, and period
- Add commission, spread where relevant, and slippage
- Save the untouched baseline
- Read net result, profit factor, trade count, exposure, and drawdown together
- Inspect outliers and the worst losing streak
- Run the planned variants: Separate breakout and pullback hypotheses; compare 1%, 2%, and 3% stops without mixing rules
- Keep a full trial log and preserve a holdout
- If evidence remains credible, observe the unchanged rule with paper signals before any real-world decision
Risk note
Backtest is an education and strategy-research tool, not financial advice, investment advice, a broker, exchange, or order-execution service. Historical simulation does not guarantee future performance. Past maximum drawdown is not a maximum future loss. Real markets can gap; liquidity, spread, slippage, fees, funding, data quality, latency, outages, taxes, and fills can differ materially from the model. Leveraged crypto, forex, and gold positions can magnify losses. Parsed strategy rules and paper signals can be wrong. Never risk capital you cannot afford to lose.
Related guides
Research sources
Backtest Trading for iOS
Continue your research on iPhone
Run another setup, inspect every simulated trade, and keep your strategy research close at hand.
Download on the App Store