Research comparison · Evidence before ranking
How to Compare Backtest Runs Like for Like
Reviewed by the Backtest Editorial Team · Editorial policy
Compare backtest runs fairly by locking market, data, rules, costs, sizing, and execution assumptions before judging changes.
Quick answer
Two backtest runs are comparable only when they answer the same research question. Lock the symbol and venue, data source and revision, timeframe, date window, direction, entry and exit rules, position sizing, fees, slippage, capital, and fill semantics. If one of those dimensions changes unintentionally, label the runs incomparable instead of ranking their returns.
A useful comparison changes one planned variable while keeping the rest of the fingerprint fixed. For example, compare a BTCUSDT one-hour EMA crossover with and without an RSI confirmation on the same candles and cost assumptions. Do not compare that candidate with an ETH pullback run and conclude that the higher profit identifies a better strategy.
Research context
Backtest comparison is an experimental-design problem, not a leaderboard. TradingView's official strategy documentation exposes date range, symbol information, inputs, capital, order size, commission, slippage, margin, and broker-emulator assumptions because each can change simulated trades. Its documentation also shows how intrabar assumptions or Bar Magnifier data can alter whether orders fill. A result without its settings is therefore incomplete evidence.
Time-series validation adds another comparability rule: test windows should represent the same duration when metrics are compared. The scikit-learn TimeSeriesSplit documentation explicitly notes that equally spaced samples are needed for comparable fold metrics and provides a gap between training and test sets. In trading research, this supports matching horizon and bar spacing rather than comparing a quiet month with an entire volatile year.
Backtrader's analyzer design attaches an analyzer to one strategy instance, which is a useful mental model: every metric belongs to a specific strategy, dataset, and execution configuration. Backtest-specific comparison should preserve those parents. The app can save runs and show history, but the researcher still owns the hypothesis, trial log, and decision rule.
Backtest app setup example
Create a baseline named LFL-001: BTCUSDT, 1h candles, January through June 2026, EMA(9) crossing EMA(21), long only, $10,000 initial capital, 2% position size, 2% stop loss, 4% take profit, 0.10% commission per fill, 5 bps slippage, signal-and-risk exits, and closed-candle evaluation. Save the run before inspecting alternatives.
Clone it as LFL-002 and change only the entry filter: require RSI(14) above 50 when the EMA cross occurs. Keep every other field unchanged. Record the intended difference in one sentence. If the provider, available candle count, period boundary, or app engine version changes, create a new comparison group rather than silently mixing the evidence.
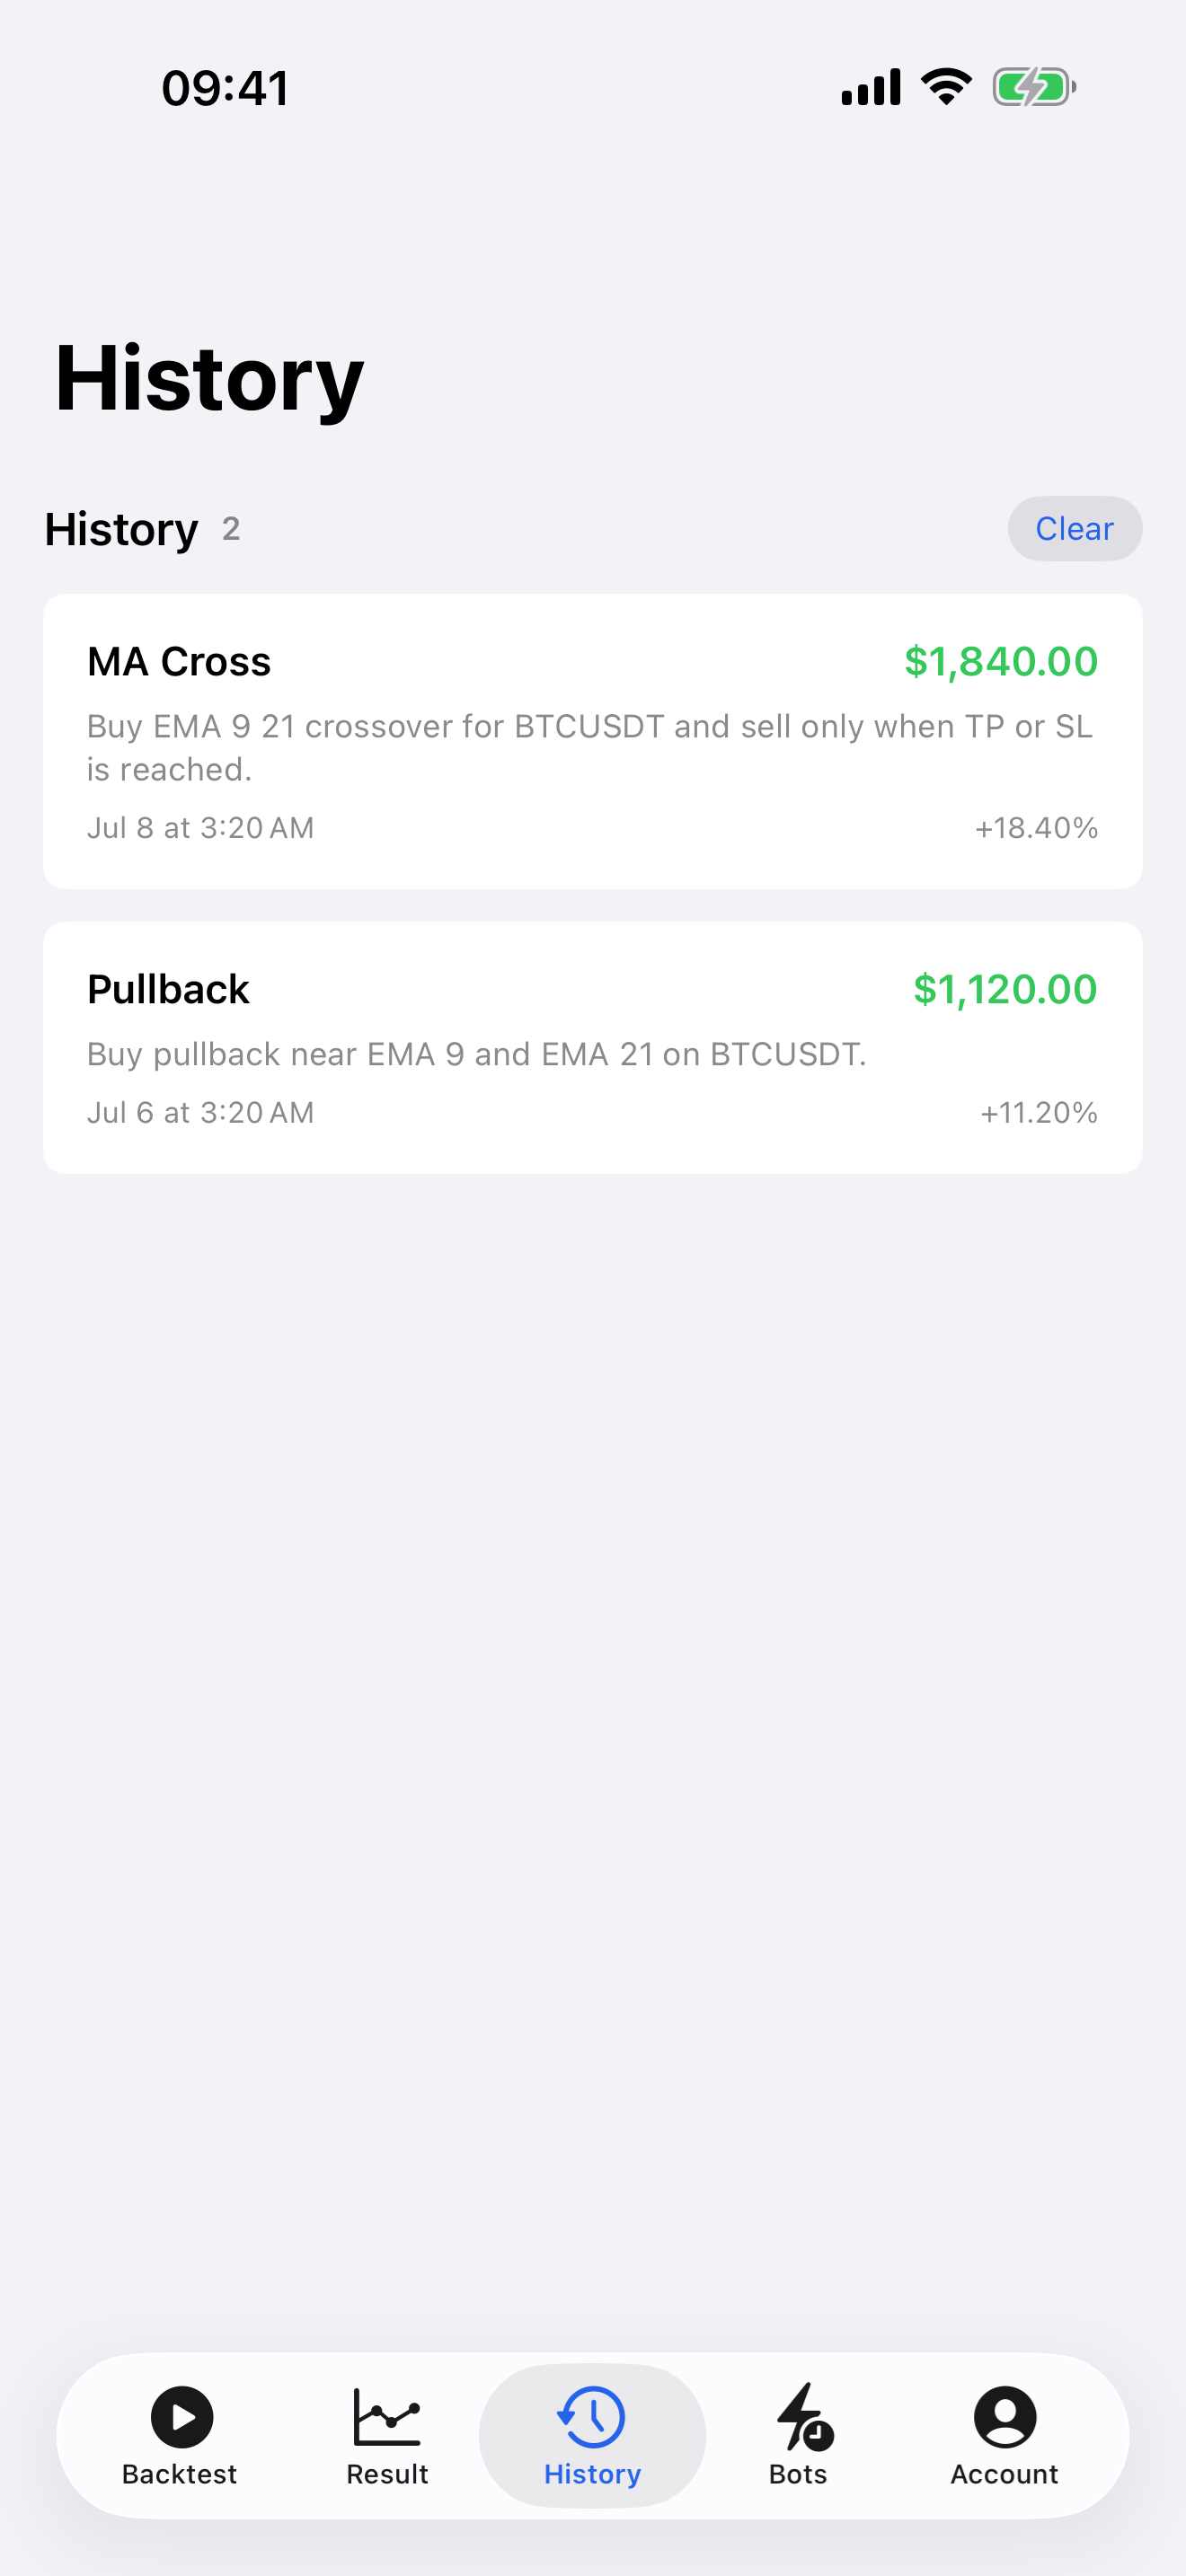
For a control, save an intentionally incompatible ETHUSDT pullback test. The History screen can display it beside the BTC runs, but a Research comparison should mark market, rule family, and data as different. It belongs in the archive, not in the ranking between LFL-001 and LFL-002.
How to read the results
Begin with fingerprint parity, not profit. Confirm the same number of eligible bars, matching start and end boundaries, direction, costs, risk settings, and exit mode. Then compare trade count, exposure, net result after costs, profit factor, average trade or average R, maximum drawdown, losing-streak length, and concentration in the largest trade.
Read differences as trade-offs. An RSI filter may reduce drawdown while also removing many trades and increasing dependence on a small sample. A higher win rate can coexist with lower expectancy. A higher net result may come from longer exposure or one outlier. Report the delta, the uncertainty, and the changed mechanism rather than declaring a universal winner.
Set pass/fail gates before opening the candidate result: minimum trade sample, maximum cost-stress degradation, acceptable drawdown change, and no single trade dominating the conclusion. If either run fails a gate, preserve it as a rejected trial. A failed comparison is still valuable evidence.
A practical comparison matrix
Use one row per run and make the immutable fields visible: hypothesis ID, market, provider, timeframe, period, candle count, rule hash, direction, sizing, capital, fees, slippage, stop, target, exit mode, and engine version. Add a Compatibility column before performance columns. Values such as Comparable, Different market, Different data window, or Different execution prevent accidental ranking.
Only after compatibility is established should the matrix show net result, trades, profit factor, drawdown, average R, MFE/MAE summaries, and holding time. This ordering keeps a visually impressive return from overriding a broken experimental design.
Sensitivity without moving the goalposts
A robust question is not which single parameter wins, but whether the conclusion survives a small planned neighborhood. Predeclare adjacent EMA lengths or a modest fee stress, run all variants, and keep the rejected outcomes. Changing the grid after seeing results increases selection bias.
When a setting wins in one window, repeat the unchanged comparison in a later locked window. Do not merge the windows and optimize again. The objective is to test whether the relative conclusion repeats, not to manufacture the smoothest full-history curve.
Versioned evidence and decision ownership
Treat the comparison record as a versioned research artifact. Store the hypothesis, run IDs, generated time, app or engine version, provider identifier, date boundaries, eligible candle count, and a compact rule-and-cost fingerprint. A screenshot helps human review, but structured fields make accidental differences easier to detect. If corrected or revised market data changes a run, preserve the previous record and identify the revision instead of overwriting the evidence that supported an earlier decision.
Separate observations from decisions. The result can say that LFL-002 had nine fewer trades, a smaller modeled drawdown, and weaker average R in the specified six-month sample. The decision layer then applies the prewritten gate and records pass, fail, or inconclusive with a reason. This prevents descriptive metrics from becoming an unqualified recommendation and lets another researcher reproduce why a candidate advanced.
Finally, distinguish compatibility from credibility. Two runs can be perfectly like for like yet both have too few trades, unrealistic cost assumptions, or unacceptable drawdown. Compatibility permits a comparison; it does not make either candidate robust. Preserve that distinction in exported tables, saved-history labels, and AI summaries so a higher metric cannot silently override a failed data-quality or risk gate.
Common mistakes
- Ranking runs from different symbols, timeframes, periods, providers, or rule families.
- Changing fees, slippage, sizing, and entry logic together, then attributing the result to one change.
- Comparing percentages when the capital base, leverage, currency, or exposure differs.
- Ignoring candle-count, missing-data, timezone, or engine-version differences.
- Selecting the winner by return alone without trade count, drawdown, costs, or outlier concentration.
- Deleting failed trials, which hides how many opportunities there were to select luck.
Practical checklist
- Write one falsifiable hypothesis and assign a comparison-group ID.
- Freeze market, provider, timeframe, period boundaries, and bar-close semantics.
- Freeze entry, exit, direction, sizing, capital, fees, slippage, stop, and target.
- Change one planned variable and name it before running the candidate.
- Verify compatible candle counts and fingerprints before viewing performance.
- Read sample size, exposure, net result, profit factor, drawdown, and average R together.
- Record outliers, rejected trials, and any incompatibility instead of deleting them.
- Repeat the frozen comparison on a later holdout before paper observation.
Risk note
Like-for-like comparison reduces a research error; it does not make a strategy safe or predictive. Backtest is an education and strategy-research tool, not financial advice, a broker, exchange, or execution service. Historical candles cannot reproduce every spread, queue, partial fill, gap, latency, outage, funding charge, or future regime. Past drawdown is not a cap on future loss, and leveraged trading can lose more quickly than a simulation suggests.
Related guides
Continue with trade-level evidence, locked holdout validation, and closed-candle paper observation. Those guides form the next three gates after a fair historical comparison.
Research sources
Backtest Trading for iOS
Continue your research on iPhone
Run the setup again, inspect every simulated trade, and keep the strategy evidence in the app.
Download on the App Store