Trade evidence · Inspect the path, not only the outcome
Trade Evidence: MFE, MAE, R-Multiple, and Holding Time
Reviewed by the Backtest Editorial Team · Editorial policy
Read MFE, MAE, R-multiple, holding time, fees, and exit context together to understand what happened inside each simulated trade.
Quick answer
MFE is the greatest favorable movement reached while a trade was open; MAE is the greatest adverse movement. R-multiple expresses the realized result relative to the initial planned risk, and holding time measures how long capital remained exposed. Together they explain the path between entry and exit—information that win rate and final P&L cannot provide.
Use the same price basis and sign convention for every trade. For a long trade, favorable movement is above entry and adverse movement is below; for a short trade the interpretation reverses. Include fees and slippage in realized P&L, keep initial 1R fixed from the entry plan, and note that OHLC candles may not reveal the exact intrabar sequence.
Research context
QuantConnect's official backtest API exposes MAE, MFE, duration, end-trade drawdown, fees, entry and exit data at trade level, plus average and largest excursion statistics. This is evidence that excursions are first-class diagnostics rather than decorative chart labels. TradingView similarly lists each trade with run-up, drawdown, entry, exit, profit, and cumulative profit.
Van Tharp's original R framework defines 1R as the initial amount the trader planned to lose if wrong and relates each profit or loss to that fixed risk. R normalizes trades with different prices or position sizes, but only if the initial stop and risk were recorded before the outcome. Moving the denominator after the trade destroys comparability.
MFE and MAE do not tell a trader what the optimal stop or target should have been. They are descriptive observations from one path. Using every trade's maximum excursion to retrofit exits is another optimization loop and needs its own holdout.
Backtest app setup example
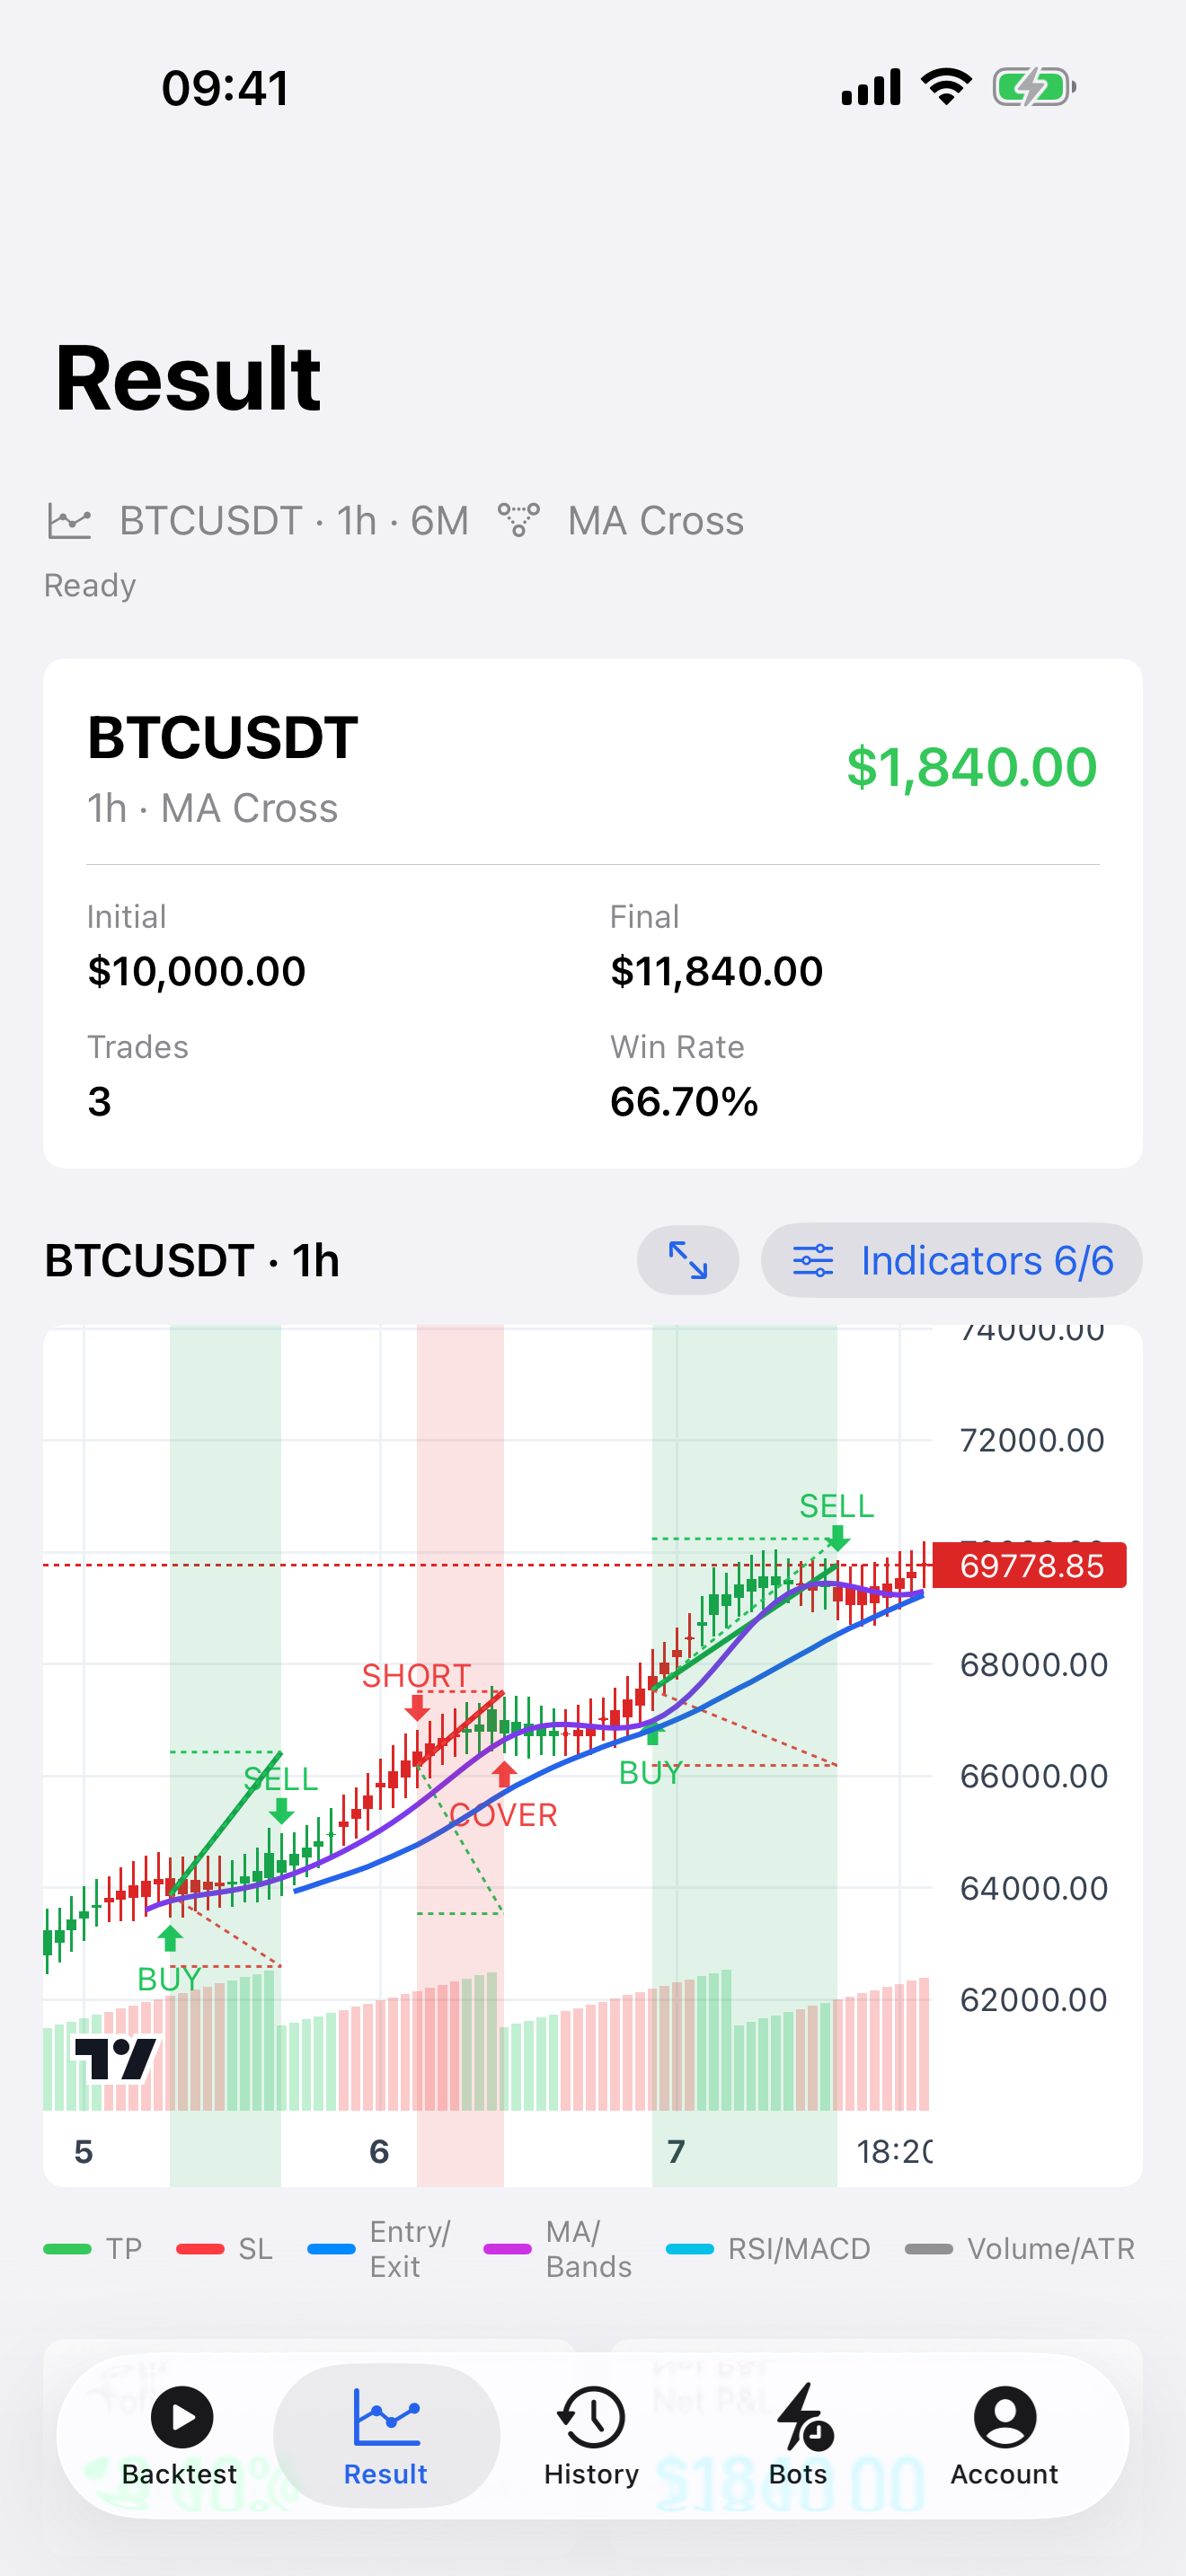
Run a concrete Backtest example: BTCUSDT, 1h, six months, Pullback, long only, $10,000 capital, 2% position size, 2% stop loss, 4% take profit, 0.10% commission, 5 bps slippage, and closed-candle signal evaluation. Save the exact setup and open the trade-detail evidence rather than reading only the summary cards.
For each trade, record entry and exit time, entry and exit price, initial stop distance in account currency, realized net P&L, maximum favorable and adverse movement while open, bars or hours held, fees, and exit reason. Normalize MFE and MAE by initial R when possible so a small BTC position and a larger-priced asset can be compared on a risk basis.
Example: Trade A realizes +1.4R after reaching +2.1R MFE and -0.4R MAE over 11 hours. Trade B stops at -1.0R after +0.6R MFE and -1.1R MAE over four hours. Trade A gave back 0.7R before exit; Trade B showed some favorable movement but never enough to cover the planned reward. Neither observation alone justifies changing the rules.
How to read the results
Start with data integrity: direction, timestamps, bar interval, fees, stop, target, and exit reason. Then compare realized R with MFE. Repeated large gaps between MFE and realized R may reveal an exit behavior worth researching, but it may also be the cost of allowing winners to develop. Compare the distribution, not one dramatic trade.
Read MAE beside the stop and final R. Winning trades that regularly approach -1R may require more psychological and capital tolerance than their win rate suggests. Losing trades with tiny MFE may indicate weak entries; losing trades with large MFE may indicate exits or intrabar ambiguity. These are hypotheses for a new test, not retrospective proof.
Holding time provides context for opportunity cost, overnight or funding exposure, and signal cadence. Segment by direction, regime, and exit reason only when sample sizes remain useful. Report median and tails as well as averages because a few long trades can distort the mean.
A compact evidence table
Use columns for trade ID, direction, entry, initial 1R, net R, MFE in R, MAE in R, holding bars, fees, and exit reason. Add a data-quality flag when both stop and target could have been touched inside the same candle. Never silently resolve an ambiguous path in the strategy's favor.
Review the largest winner, largest loser, median trade, deepest MAE winner, largest giveback, and longest holding trade. This small but deliberate sample often reveals more than scrolling through only profitable examples.
From observation to a new hypothesis
If winners repeatedly reach +2R but realize +0.3R, formulate a separate exit hypothesis and freeze it before testing. If most losers have immediate adverse excursion, formulate an entry-timing question. Do not edit the original run or claim the new rule would have worked without a fresh simulation.
Evaluate the candidate against the original on the same data and costs, then reserve a locked holdout. Trade evidence guides the next question; it does not grant permission to reuse the answer.
Calculation conventions that must stay visible
Define excursion from the same price stream used by the simulator. For a long trade, price minus entry is favorable when positive; for a short trade, entry minus price is favorable. Normalize by the initial account-currency risk only when that risk is positive and recorded at entry. A trade with no valid initial stop should not receive a fabricated R-multiple; report its currency and percentage outcome separately and flag the missing denominator.
Decide whether commission and slippage belong in the excursion path, realized result, or both, and label the convention. Market-price MFE may describe the opportunity visible in candles, while executable MFE after spread and costs answers a different question. Neither is universally correct, but mixing them across runs produces false precision. Funding, rollover, borrow costs, and currency conversion also need explicit treatment when relevant to the instrument.
Candle resolution limits every path statistic. A one-hour high and low establish bounds, not the exact route between them. When stop, target, and a signal exit can occur inside one bar, record the simulator's precedence and stress a less favorable ordering. Higher-resolution data can reduce ambiguity but introduces its own coverage, synchronization, and cost assumptions; version it as a new evidence source rather than silently substituting it.
Common mistakes
- Confusing MFE with realized profit or MAE with the final loss.
- Using close-only prices while describing excursion as if tick order were known.
- Recomputing 1R from a later stop instead of the risk fixed at entry.
- Ignoring commissions, slippage, funding, or gaps in realized R.
- Averaging excursions across long and short trades without a consistent sign convention.
- Optimizing stops and targets on the same excursion sample and reporting it as independent evidence.
Practical checklist
- Verify symbol, timeframe, period, direction, and execution assumptions.
- Record entry-time risk and keep 1R fixed for the life of the trade.
- Calculate net realized R after modeled costs.
- Capture MFE, MAE, duration, exit reason, and any ambiguous candle.
- Review distributions and representative tails, not only averages.
- Separate observations from proposed rule changes.
- Run any new exit or entry hypothesis as a fresh named candidate.
- Validate the frozen candidate out of sample before paper monitoring.
Risk note
Trade evidence describes a historical simulation and cannot guarantee an obtainable fill or future path. Backtest does not place real orders and is not financial advice. OHLC data can hide the order of intrabar prices; real spreads, liquidity, queue priority, partial fills, gaps, latency, fees, funding, and outages can produce worse outcomes. A historical 1R stop can lose more than 1R in a gap or fast market.
Related guides
Use like-for-like run comparison before judging an evidence-driven candidate, then protect a holdout and observe the unchanged rule on future closed candles.
Research sources
Backtest Trading for iOS
Continue your research on iPhone
Run the setup again, inspect every simulated trade, and keep the strategy evidence in the app.
Download on the App Store