Article contents
- Evidence and scope
- Illustration
- Process
- A squeeze identifies dispersion rather than direction
- Calculate the reference without using the trigger
- Numerical squeeze, successful path and head fake
- Expansion needs a complete exit and order policy
- Add volume as a testable feature
- Separate the value of squeeze from the value of breakout
- Common pitfalls
- Practical checklist
- Frequently asked questions
- Research sources
Evidence and scope
John Bollinger's official material supports the band formula and Squeeze terminology. The percentile trigger, frozen boundaries and execution rules here are research proposals, not profit claims from a book or a newly run backtest.
 Open full-size illustration
Practical workflow
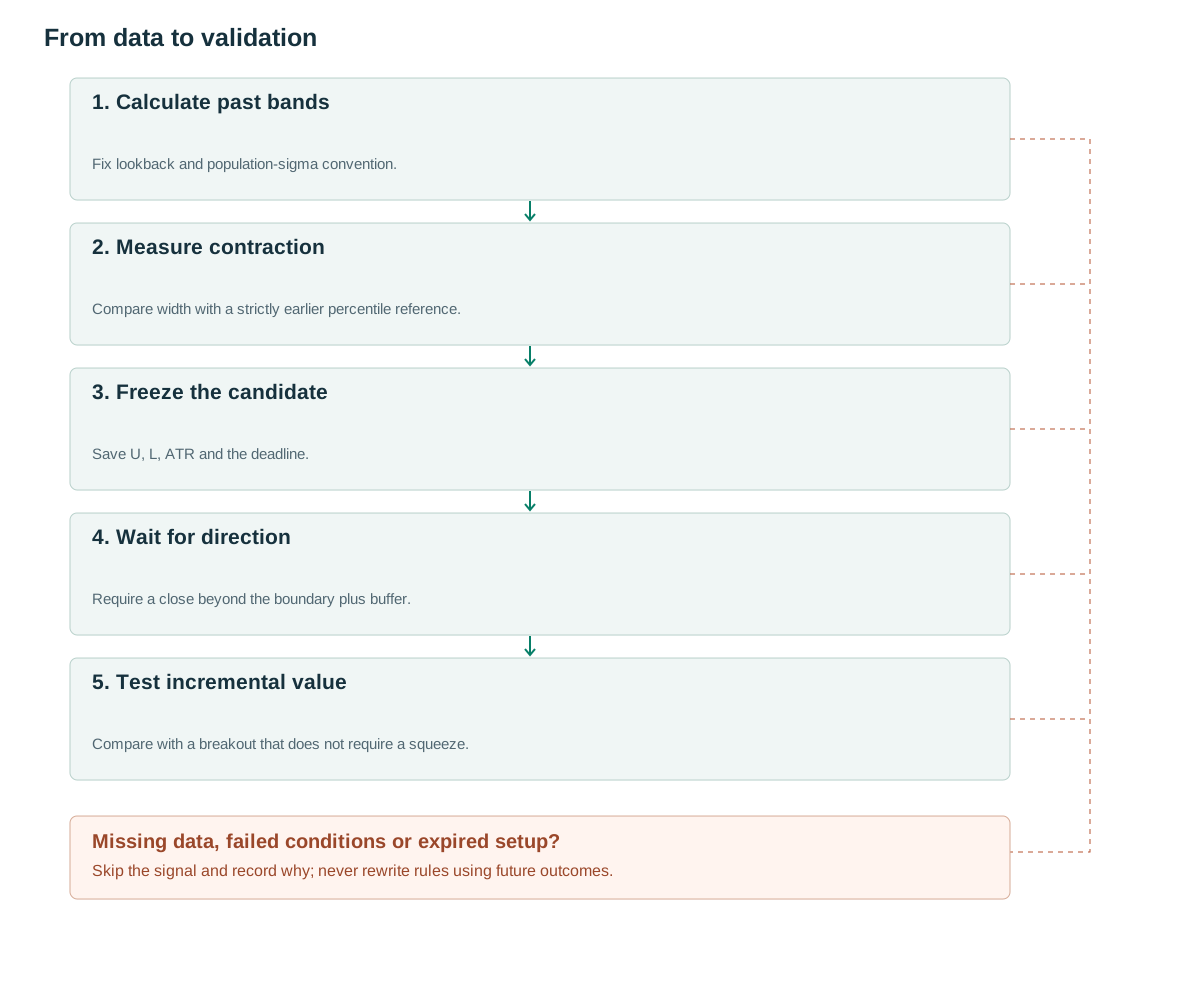
- Calculate past bandsFix lookback and population-sigma convention.
- Measure contractionCompare width with a strictly earlier percentile reference.
- Freeze the candidateSave U, L, ATR and the deadline.
- Wait for directionRequire a close beyond the boundary plus buffer.
- Test incremental valueCompare with a breakout that does not require a squeeze.
A squeeze identifies dispersion rather than direction
John Bollinger describes bands based on a moving average and population standard deviation, with the familiar 20-period and 2-standard-deviation defaults [1]. The official Methods overview presents a volatility-breakout application called the Squeeze [2]. These sources establish terminology, not an audited win rate for this article's configuration.
Low BandWidth does not specify whether price will break upward, downward or remain quiet. Buying immediately when the width is small and buying only after a subsequent break are different hypotheses. The proposed baseline waits for a close outside frozen boundaries.
Relative contraction also differs from small absolute movement. A volatile instrument can be in its lowest historical BandWidth percentile while still moving much more than a quiet instrument. Record both percentile rank and absolute or ATR-normalized width so a portfolio does not confuse an unusual state with low execution risk.
Calculate the reference without using the trigger
Using 20 closes through t−1, calculate mu=mean(C), sigma=sqrt(mean((C−mu)²)), U=mu+2sigma, L=mu−2sigma and BW=(U−L)/mu. The proposed squeeze requires BW[t−1]≤the 20th percentile of the preceding 100 widths, from t−101 through t−2. Fix nearest-rank or interpolation behavior before testing.
At the first qualifying squeeze, freeze U, L and ATR_ref for a candidate lasting five evaluated bars. Consecutive squeeze observations do not reset the deadline. A long requires a close above U+buffer; a short mirrors this below L−buffer. The 20th percentile, 100-observation comparison and five-bar lifetime are research settings.
The baseline excludes the triggering close from the frozen band calculation. A continuously updated band containing that close answers a different question because the breakout itself changes mean and dispersion. Store band_used and the reference window with each signal so two implementations can be compared at the event level.
Warm-up requires enough complete observations to calculate every width used in the percentile reference, not merely 20 prices. Missing data must not silently shorten that history. Define a minimum positive mean and reject or separately handle zero-dispersion windows before they generate uneconomic zero-width candidates.
if no_candidate and BW[t-1] <= quantile(BW[t-101:t-1], 0.20):
    candidate = freeze(U[t-1], L[t-1], ATR[t-1], expires=t+4)
if candidate:
    b = max(2*tick, 0.1*candidate.ATR)
    if t > candidate.expires: expire()
    elif C[t] > candidate.upper+b: emit_long(t)
    elif C[t] < candidate.lower-b: emit_short(t)
# At most one signal per candidate; orders follow the close.
Numerical squeeze, successful path and head fake
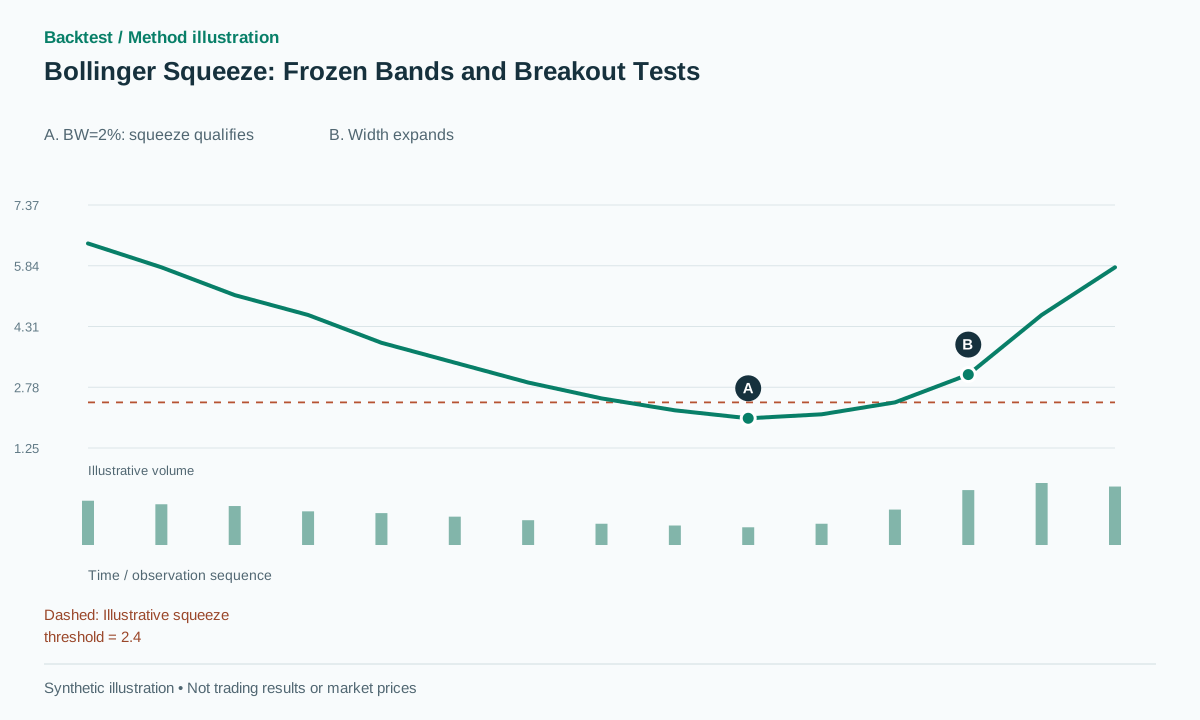
Synthetic mu=100 and sigma=0.5 give U=101, L=99 and BW=2%. If the previously established percentile threshold is 2.4%, contraction qualifies. With buffer 0.1, a later close 101.3 triggers a long. Entry 101.4 and stop 98.9 imply 2.5 points of price risk, with a proposed 2R target 106.4.
A synthetic path reaching106.4 before the stop succeeds under that rule. In the failed-break path, price returns to 100 and then falls to 98.8. The squeeze and breakout were both valid observations, yet the trade loses. This is precisely why a detector's correct classification must remain separate from the strategy outcome.
If the close is 100.9 while the high reaches 101.5, the close-confirmed baseline has no long signal. Do not switch that historical event to a stop-entry interpretation because it later produces an attractive move. A resting-stop version can be studied independently with its own fills and failures.
Using sample sigma with denominator 19 instead of population denominator 20 produces different bands from identical input. That choice is not inherently invalid as a statistical model, but it is a different indicator convention and can change borderline signals. Include a small hand-calculated fixture to verify the intended denominator.
Expansion needs a complete exit and order policy
The proposed baseline enters at a subsequent executable open, stops beyond the opposite frozen boundary and uses a 20-bar time exit. A=2R target can be replaced with a trailing stop only as a separately registered experiment. If an observed quote makes risk unacceptable before submission, a fixed rejection rule can apply; an existing fill cannot be deleted.
Bollinger's rules distinguish a band touch from a trading signal and note that trends can continue along a band [3]. Therefore a breakout system should not suddenly open an opposing mean-reversion trade merely because price reaches the upper band. Define the strategy state and any reversal policy explicitly.
A frozen candidate preserves its original geometry while the broader indicator continues updating for later candidates. After a fill, store the target, stop and time-exit activation times. If both stop and target occur within one OHLC bar, use finer data or a declared adverse sequencing assumption.
Candidate expiration is informative. A squeeze that remains quiet for five bars is an expired opportunity under this version, not a forgotten observation. Extending every quiet candidate until a large move finally happens would alter waiting time, risk exposure and the apparent success rate.
Add volume as a testable feature
One experiment requires breakout RVOL≥1.5, using a same-time intraday baseline or a median of 20 preceding daily sessions. Another examines declining activity during the squeeze. These are proposed features and should be tested separately before their combination is credited with an improvement.
The author's rules encourage avoiding redundant indicators [3]. In practical testing, volume can still correlate strongly with price range. Compare within similar volatility groups to ask whether it adds information rather than merely selecting wider breakout bars.
A squeeze in an inactive instrument may reflect stale prices instead of meaningful compression. Store dollar volume and spread independently from the squeeze flag. A narrow channel whose width is comparable to the bid–ask spread may offer poor economics even if the eventual gross move looks large.
Full breakout-bar volume is available only after the bar closes. A strategy with orders resting before that close must use partial information or a prior volume filter. Matching feature availability to order timing prevents a convincing-looking volume confirmation from introducing look-ahead bias.
Separate the value of squeeze from the value of breakout
Compare a price-only breakout, a breakout after a squeeze and that same configuration with volume. Keep universe, risk, costs and test periods consistent. Report squeezes without triggers, holding time, whipsaws, net expectancy and portfolio exposure rather than only the largest expansions.
Fixtures should cover zero sigma, near-zero mean, incomplete warm-up, percentile ties, consecutive squeezes and a bar crossing both frozen boundaries. Perturb the current close and confirm that the prior snapshot remains unchanged. Compare batch calculations with streaming replay.
The official rules do not justify interpreting ±2sigma as a guaranteed 95% range for the next price [3]. Financial return dependence and distribution shape differ from the assumptions behind a simple normal interval. The channel is an indicator convention, not a confidence statement about the next trade.
Register nearby percentile, window and TTL choices as research trials. A robust region of behavior is more informative than one isolated optimum. If the squeeze filter merely lowers opportunity count without a meaningful improvement in a predefined net metric, the simpler breakout baseline remains a valid research conclusion.
Common pitfalls
Inferring direction from narrow bands
Contraction describes past dispersion and does not identify the next breakout direction.
Mixing bands from t and t−1
They produce different signal populations; record the exact snapshot used.
Treating inactive prices as a tradable squeeze
Narrow observed ranges can coexist with spreads too wide for the proposed strategy.
Checklist before using this method
Check each item after verifying it on your data. Progress is saved in this browser; it does not certify a profitable strategy.
Frequently asked questions
Is this the same as Bollinger Bands inside Keltner Channels?
No. That is a different squeeze definition from a historical BandWidth percentile and needs separate versioning and evaluation.
Should an upward break that returns inside be shorted immediately?
Only under a separately specified failed-break strategy. The original long must still be managed and recorded under its own exit rules.
Research sources
Each source supports the definition or evidence described beside it. The pseudocode, synthetic examples and proposed parameters require separate validation.
- A complete explanation of Bollinger BandsJohn Bollinger. Read the official formula explanation; the full paid book was not read. Checked: .
- Methods ExplanationBollinger Bands. Read the Method I–IV overview without inferring a backtest result. Checked: .
- Bollinger Bands RulesJohn Bollinger. Read rules on band tags, indicator combinations and statistical limitations. Checked: .
Related methods
Risk note
This content supports education and research design, not financial advice. Backtest is historical simulation, does not guarantee future performance and does not place real trades. Methods in this library are not automatically features available in the app. See methodology and learning center.
Validate rules before risking real capital
Check app support, data and individual simulated trades; advanced detectors may require a separate implementation.
Download Backtest on the App Store