Article contents
- Evidence and scope
- Illustration
- Process
- Waiting for a retest changes the opportunity set
- Freeze the reference and the first eligible retest
- Compare the same time of day
- Synthetic qualifying retest and failed paths
- Choose protection before seeing the outcome
- Include an immediate-breakout control
- Common pitfalls
- Practical checklist
- Frequently asked questions
- Research sources
Evidence and scope
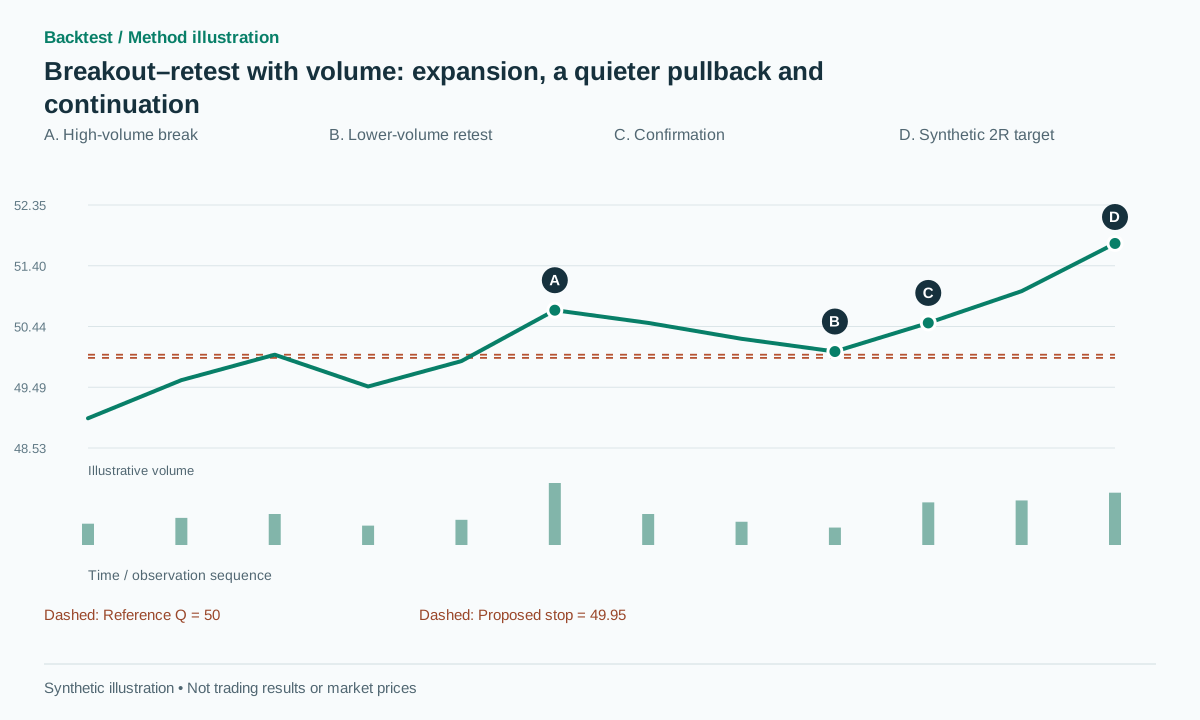
Fidelity discusses retest and lower-volume consolidation, while SMB reviews a specific entry. These are educational examples, not a backtest of the algorithm proposed here.
 Open full-size illustration
Practical workflow
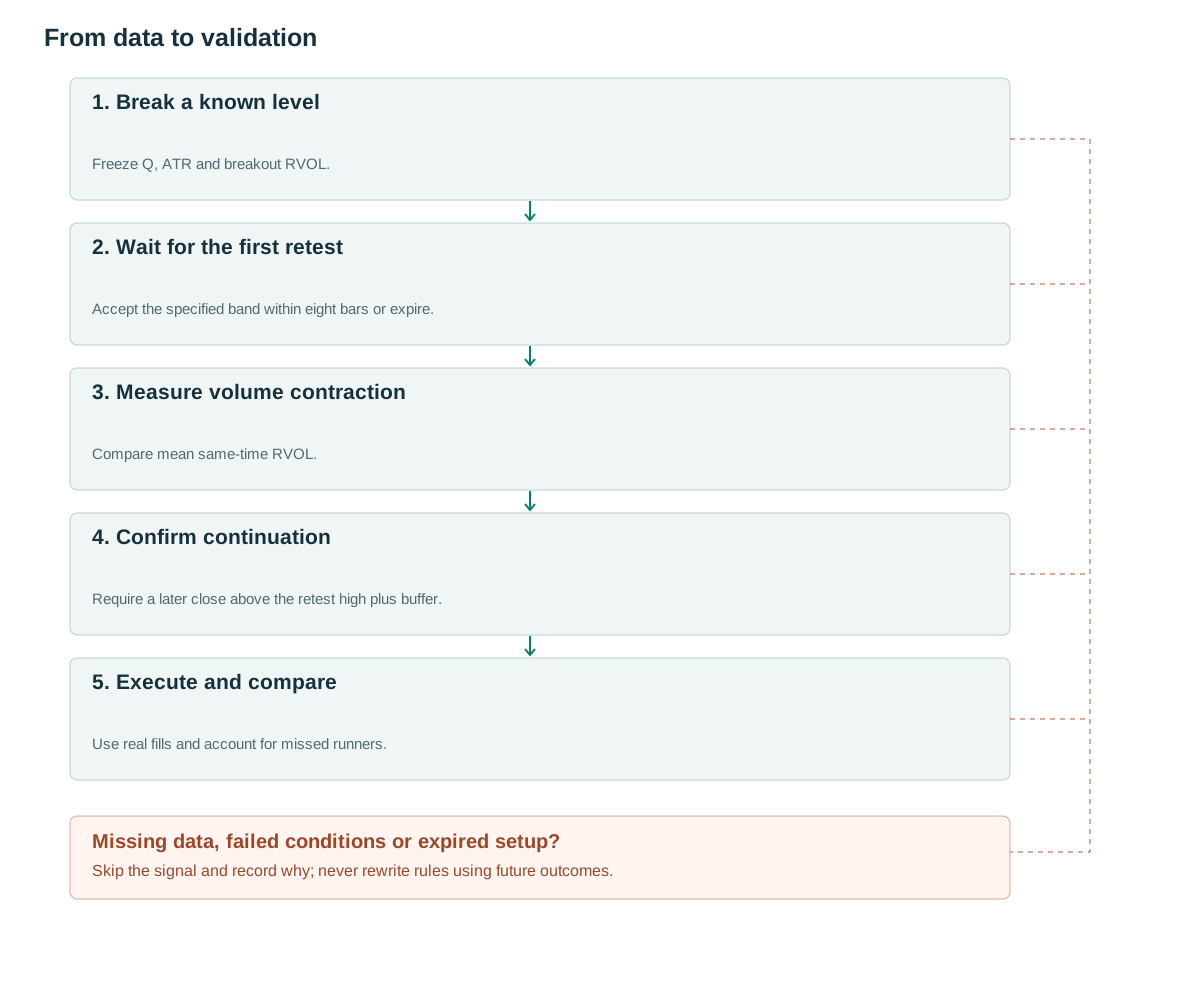
- Break a known levelFreeze Q, ATR and breakout RVOL.
- Wait for the first retestAccept the specified band within eight bars or expire.
- Measure volume contractionCompare mean same-time RVOL.
- Confirm continuationRequire a later close above the retest high plus buffer.
- Execute and compareUse real fills and account for missed runners.
Waiting for a retest changes the opportunity set
Fidelity discusses retesting a breakout with reduced activity during consolidation [1]. An SMB review emphasizes entry location after the break [2]. The research question is whether waiting improves risk/reward enough to compensate for the moves that never return.
A breakout need not retest. Studying only charts that returned and bounced excludes strong runners with no entry and failed breakouts that fell through the level. Create the candidate when the break occurs, then let the state machine classify retest, expiry or failure.
Volume has three possible roles: unusual activity at the initial break, participation during the pullback, and renewed activity at continuation. Do not assume requiring all three is best. Low volume can also accompany insufficient demand and an easy decline, so a quiet retest remains a hypothesis rather than proof of support.
Freeze the reference and the first eligible retest
For a proposed bullish five-minute version, let Q be the maximum high of the 20 bars preceding t, excluding t. Set A=ATR14[t−1], b=max(2 ticks,0.10A) and eps=max(2 ticks,0.15A). A break requires C[t]>Q+b, C[t−1]≤Q, close location(C−L)/(H−L)≥0.70 and RVOL[t]≥1.5. A zero-range bar cannot supply that ratio. Freeze Q, A and both buffers.
Within t+1 through t+8, lock the first bar r whose low lies in[Q−eps,Q+eps] and whose close is at least Q. A prior close below Q−eps cancels the candidate. Mean RVOL from t+1 through r must be no more than 0.7 of break RVOL. If it fails, reject this filtered candidate rather than selecting a prettier later retest.
During the next three bars after r, the first close above H[r]+b creates a signal. Place protection below the minimum low from t+1 through the signal, minus b, and enter at the following executable quote. All lengths and thresholds are proposed research parameters. The short version reverses geometry, but its volume effects must still be tested separately.
A subtle case is a bar whose low passes entirely beneath the retest band but closes back above Q. The stated low-in-band rule does not accept it as r. An intersection-based version could, but that is a different detector and should receive a new version identifier.
Reject a breakout bar with H≤L. An undefined close-location ratio does not waive the filter, including for a zero-range bar that gapped beyond the reference level.
after_breakout_close(t):
  if H[t]<=L[t] or not complete_prior_features: reject(); return
  candidate = freeze(Q,A,b,eps,break_rvol,session_id,
                     cutoff=session_end-5_minutes,known_at=received_close_time(t))
  if received_close_time(t)>=candidate.cutoff: expire(); return
  r = None
  for u in t+1..t+8:
    if session_id(u)!=candidate.session_id or received_close_time(u)>=candidate.cutoff:
      expire(); return
    if C[u]<Q-eps: cancel(); return
    if first_valid_retest(u):
      r=u; break
  if r is None: expire_no_retest(); return
  if missing_rvol(t+1,r) or mean_rvol(t+1,r)>0.7*break_rvol:
    reject_volume(); return
  for u in r+1..r+3:
    if session_id(u)!=candidate.session_id or received_close_time(u)>=candidate.cutoff:
      expire(); return
    if C[u]<Q-eps: cancel(); return
    if C[u]>H[r]+b:
      stop=min(L[t+1:u+1])-b
      consume_candidate_then_order_on_next_quote_if_before_cutoff()
      return
  expire_no_confirmation()
# A session-close timer also expires waiting candidates when no new bar arrives.
Compare the same time of day
Proposed RVOL_bar divides current volume by the median volume in the matching time slot over the previous 20 sessions. TradingView uses an average for its Relative Volume at Time indicator [3]; the median here is an intentional research variation. Do not attribute results from one estimator to the other without retesting.
A one-bar breakout and six-bar pullback should not be compared by raw total volume. Mean same-time RVOL controls for both duration and intraday activity patterns. Shortened sessions, halts and unavailable baselines should produce insufficient_data rather than a conveniently substituted value.
A signal-bar expansion threshold, such as RVOL≥1.2, can be added as a separate experiment. Relative strength or an EMA trend filter should likewise be measured incrementally. End-of-day volume and the day’s eventual winning stocks cannot select a morning entry.
Synthetic qualifying retest and failed paths
Let Q=50, A=1 and tick=0.01, so b=0.10 and eps=0.15. A break bar with H50.80, L49.90 and C50.70 has close location 0.80/0.90, about 0.889, and RVOL2. Pullback RVOL observations 1.0,0.8 and 0.6 have mean 0.8, below the allowed 1.4. The retest bar has low 50.05, high 50.35 and close 50.15.
The next close 50.50 exceeds 50.45. Buying at 50.55 with the observed pullback minimum 50.05 gives stop 49.95, risk 0.60 and a 2R target 51.75. The confirmed version cannot claim entry 50.00 simply because price visited Q before confirmation. A resting limit at Q would have a different information and fill path.
A close 49.80 before confirmation cancels the candidate because it is below 49.85, even on low volume. After a valid fill, a stop execution 49.90 loses 0.65 from 50.55. If price instead runs directly to 52 without retesting within eight bars, record no-retest. That rally is not profit earned by a strategy that held no position.
Choose protection before seeing the outcome
A stop beneath the entire pullback differs from a stop beneath only r. This baseline uses the known minimum from t+1 through the signal. Do not widen protection to an older base after entry merely to keep a losing trade alive.
For a decision submitted only after confirmation, a quote that gaps too far can be rejected under a predetermined risk or reward rule. An entry order that was already resting must instead retain any fill before cancellation. These alternatives should not share one optimistic simulation.
The proposed intraday baseline exits at 2R, the protective stop,20 bars after entry or before the session close, whichever applies first. Compute the target from the actual fill. A swing-trailing version requires a causal swing detector and separate statistics.
Several correlated stocks can break out after the same market news. Limit portfolio risk rather than allocating a full independent budget to every symbol. Record spread divided by stop distance; a small currency cost can consume a large portion of R when the retest stop is tight.
The baseline sets its entry cutoff five minutes before the scheduled session close, including shortened sessions. Each candidate retains its session_id and, where VWAP is used, its anchor_id. Reaching the cutoff, changing session, or resetting the anchor terminates the pending event. The post-signal quote must also arrive before the cutoff. A session timer cancels waiting states even if no further bar arrives; their bar counters cannot continue the next morning. This cutoff is an article-defined research choice.
Include an immediate-breakout control
Start with the same breakout population and compare buying after the break, waiting for a retest without volume filters, and waiting with those filters. Keep risk budgets and trading calendars comparable. Report both expectancy per fill and returns per allocated day.
Measure retest probability, waiting time, volume rejection, no-fill, MAE/MFE and net returns. A higher win rate can coexist with lower total profit because the strategy misses strong runners. Match controls by time, trend and volatility to check whether volume merely selects a favorable regime.
Use chronological validation and group overlapping candidates. Inspect nearby retest lengths and RVOL thresholds rather than one sharp optimum. Prefix replay should prove that Q does not follow the new breakout high and that the identity of the first retest never changes with later data.
Retain the unfiltered candidate table, including every rejection reason. That table allows a later researcher to reproduce the opportunity cost of each condition without rerunning selection on a different universe. It also exposes whether apparently better results came mainly from fewer trades or from genuinely different subsequent paths.
Common pitfalls
Selecting only charts that bounced
No-retest and failed-retest outcomes are essential parts of the denominator.
Low volume always means bullish
Quiet activity does not by itself establish buying support.
Buying Q after seeing the rebound
Without a prior resting limit, that is a retrospective fill.
Checklist before using this method
Check each item after verifying it on your data. Progress is saved in this browser; it does not certify a profitable strategy.
Frequently asked questions
Should the strategy chase if no retest appears?
This version skips the move. Direct breakout entry is a separate branch to compare rather than an improvised exception.
Must the retest touch one exact price?
No. The tolerance is fixed in ticks and ATR before the event. Its width is a parameter to validate.
Research sources
Each source supports the definition or evidence described beside it. The pseudocode, synthetic examples and proposed parameters require separate validation.
- Entry and Exit Strategy: What you need to considerFidelity / OCC. Read the transcript’s retest, failed-breakout and volume discussion; not a backtest. Checked: .
- How to improve your trading entriesSMB Capital. Read the original 10 August 2020 ADT review transcript; no audited strategy P&L. Checked: .
- Relative Volume at TimeTradingView. Read the same-time RVOL definition; median 20 is this article’s separate proposal. Checked: .
Related methods
Risk note
This content supports education and research design, not financial advice. Backtest is historical simulation, does not guarantee future performance and does not place real trades. Methods in this library are not automatically features available in the app. See methodology and learning center.
Validate rules before risking real capital
Check app support, data and individual simulated trades; advanced detectors may require a separate implementation.
Download Backtest on the App Store