Article contents
- Evidence and scope
- Illustration
- Process
- The label does not establish fair value
- Publish the zone after the third candle
- Measure the impulse and the return separately
- Synthetic midpoint, full-fill and losing examples
- Midpoint limits and closing confirmation are different trades
- Fill probability is not profitability
- Common pitfalls
- Practical checklist
- Frequently asked questions
- Research sources
Evidence and scope
The original source publishes an FVG detector with additional conditions. This article separates basic geometry from proposed filters and has not independently verified fill rates or trading profitability.
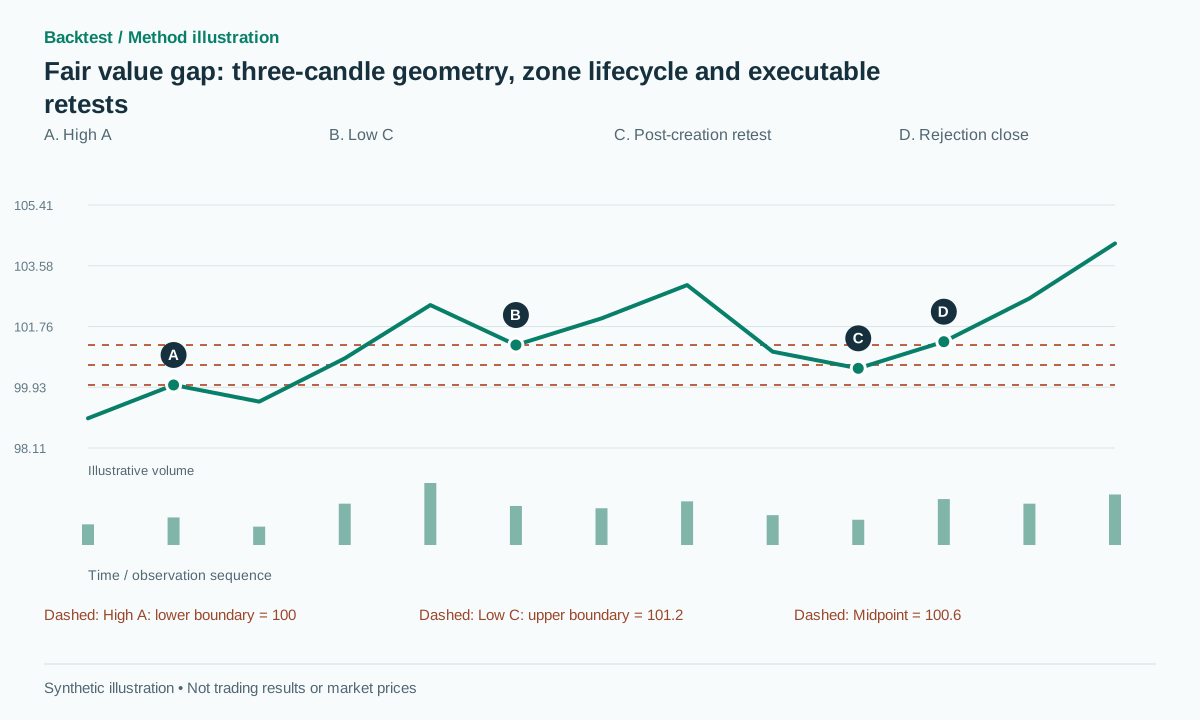 Open full-size illustration
Practical workflow
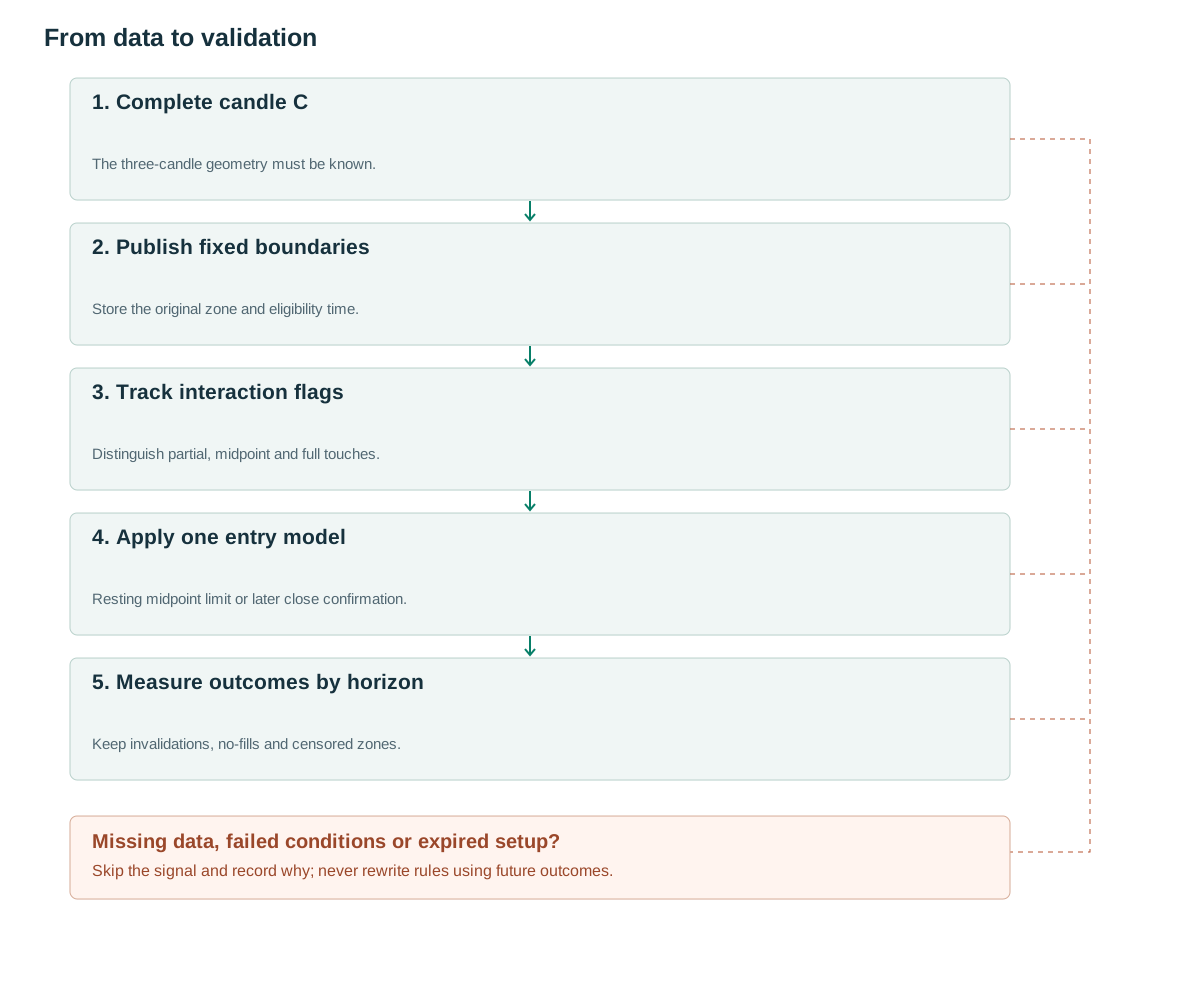
- Complete candle CThe three-candle geometry must be known.
- Publish fixed boundariesStore the original zone and eligibility time.
- Track interaction flagsDistinguish partial, midpoint and full touches.
- Apply one entry modelResting midpoint limit or later close confirmation.
- Measure outcomes by horizonKeep invalidations, no-fills and censored zones.
The label does not establish fair value
For consecutive candles A, B and C, a bullish FVG exists when the low of C is above the high of A. The interval between those prices forms the zone. Candle B may have traded through the entire interval, so saying no transactions occurred there is not justified by OHLC. Actual empty-price observations require trade-level data.
LuxAlgo’s published detector adds a middle-close condition and a threshold [1]. The minimal baseline here records geometry first, then treats middle-close, displacement and BOS as separate versions. That separation helps determine whether a filter adds value or merely draws fewer rectangles.
A three-candle FVG is also different from an overnight gap. One describes a relationship among bars and the other a discontinuity across sessions. If they overlap, retain a gap_session flag rather than combining their fill statistics as though they necessarily share one mechanism.
Publish the zone after the third candle
For a bullish zone, require L[t]>H[t−2] and store [H[t−2],L[t]]. For bearish geometry, require H[t]<L[t−2] and store [H[t],L[t−2]]. Use completed bars. A proposed size filter is width≥max(2 ticks,0.15ATR[t−1]); preserve raw_fvg and eligible_size separately so rejected small zones remain auditable.
Create zone_id, created_at and eligible_from=t+1. Freeze both original boundaries even after price enters the zone. A chart may display a shrinking unfilled remainder, but store residual_zone separately so it cannot rewrite the original entry and stop. Record width in ATR units, age, direction and the trend context known at creation.
For a bullish zone, partial touch means price enters the interval, midpoint_touch means low≤midpoint, and full_fill means low≤zone_low. These are interaction flags. Proposed invalidation is close<zone_low−b, so a full wick fill is not automatically invalidation. A wick-invalidation policy is a different experiment.
Define event priority for an existing resting order. A later bar can touch the midpoint, cross a stop and close below the zone. Processing close-based invalidation before the intrabar fills would incorrectly remove the losing trade. Replay the sequence when possible or apply a documented conservative convention.
For the illustrated baseline, freeze b=max(2 ticks,0.05×pre-creation ATR) for invalidation and protection; use reclaim_margin=one tick for the confirming close above zone_high. These distinct margins are research choices. With tick 0.05 and ATR 2 in the example, b=0.10 and reclaim_margin=0.05. The pseudocode processes existing order fills before close-based cancellation and uses the current bar index throughout.
Only ACTIVE zones can generate new entries. EXPIRED and INVALIDATED are terminal; a later recovering close cannot revive a failed zone. The entry evaluator must follow the preregistered first-touch or finite-attempt policy and consume an attempt when it signals. Close-based cancellation still cannot erase a fill that already occurred.
on_completed_bar(t):
  process_resting_order_events_up_to_close(t,respect_order_expiry=True)
  for zone in active_zones_published_before_bar(t):
    if t > zone.created_at+20:
      zone.state = EXPIRED; cancel_future_orders(zone); continue
    record_partial_mid_full_touches(zone.original_bounds,t)
    if C[t] < zone.low-zone.b:
      zone.state = INVALIDATED; cancel_future_orders(zone); continue
    evaluate_registered_entry_version_after_received_close(zone,t)
    # The registered attempt policy consumes or keeps an otherwise active zone.
  A = ATR14[t-1]
  if not finite_positive(A) or not valid_three_bar_history(t): return
  if L[t] > H[t-2] and L[t]-H[t-2] >= max(2*tick,0.15*A):
    create(zone=[H[t-2],L[t]],known_at=received_close_time(t),
           eligible_from=t+1,b=max(2*tick,0.05*A),reclaim_margin=tick)
# Fills of existing orders precede close-based cancellation.
# The creation candle is never its own post-publication retest.
Measure the impulse and the return separately
Geometric FVG detection does not require volume. One proposed feature compares middle-candle volume with a same-time median; another compares return volume with the impulse over equal durations. Zones created during a news shock may behave differently from those in ordinary trading, so retain the event context.
A volume profile used at entry must contain only trades available by that time. Large middle-candle volume is entirely consistent with the FVG definition; the interval may have substantial historical trading. FVG, a low-volume node and order-book imbalance are therefore different features.
The percentage eventually filled belongs in an outcome table, not the creation-time feature table. Using a zone’s entire future history to decide whether it was attractive at birth is leakage. The same restriction applies to selecting only zones that remain visible on a chart after invalidated zones have been removed.
Synthetic midpoint, full-fill and losing examples
Let high A=100 and low C=101.20. The zone is [100,101.20], midpoint 100.60. With ATR=2 and tick=0.05, width 1.20 exceeds the proposed minimum 0.30. The zone exists only after C closes. A later return with low 100.50 and close 101.30 reaches the midpoint without completely filling the interval.
Suppose a confirmation version requires a close above zone_high+0.05. A subsequent executable buy at 101.35, stop 99.90 and target 104.25 has risk 1.45 and reward 2.90, or 2R before costs. This is a potential winning path only if the target becomes executable before protection triggers.
A different return with low 99.60 and close 99.70 both fully fills and invalidates the zone. A close-confirmation strategy should not enter from that bar. But a midpoint buy limit at 100.60 that was already resting may have filled and then stopped below 99.90. Its fill cannot be deleted after inspecting the final close. If price never returns before TTL, record no-fill rather than inventing a win or loss.
Midpoint limits and closing confirmation are different trades
A midpoint-limit version places its order only after zone publication. It needs a spread, queue and touch-versus-fill model. A confirmation version waits for entry into the zone and then a bullish close back above its upper boundary. Its entry is usually higher, but the price response has already been observed. Do not combine the limit’s favorable price with the confirmation version’s hindsight selectivity.
A proposed baseline uses TTL=20 bars and only the first eligible retest. A touch during the creation candle is not a tradable post-publication retest. A higher-timeframe FVG must wait for that timeframe’s close according to feed timing [2].
A stop outside the far edge is one risk model; a structural swing stop is another. Simulate the actual order type [3]. Fixed 2R, a previous known high and a time exit should have separate statistics. An opposite FVG that does not yet exist cannot be selected as the intended future target.
Overlapping zones need a deterministic choice: the newest eligible zone, the nearest boundary or an explicitly combined interval. Store the decision. Choosing whichever midpoint later offered the best entry creates hidden selection even if every individual zone was calculated causally.
Fill probability is not profitability
Specify a horizon when reporting fill probability, such as 10,20 or 50 bars. A zone created near the dataset end has not had the same observation period as an older zone. Mark incomplete horizons as censored rather than treating them as never filled. Report time to partial, midpoint and full interaction separately.
Compare FVGs with synthetic zones matched by width, distance from price and trend. Many prices are revisited, so a high touch rate may not be unique to this geometry. Measure the response after the first touch and the return after an executable entry.
Test neighboring thresholds, TTLs and first-versus-second-touch policies with realistic costs and no-fills. Include capital-level returns and inactive days for a strategy that waits for rare retracements. A high percentage of filled zones can coexist with poor trading results if returns tend to reach the stop before moving toward the target.
Common pitfalls
Assuming no trades occurred
The middle candle may have traded through the whole interval.
Combining incompatible entry advantages
A midpoint limit and a confirmed close do not have the same information or fill path.
Treating a high fill rate as an edge
Touch probability says nothing by itself about net returns after entry.
Checklist before using this method
Check each item after verifying it on your data. Progress is saved in this browser; it does not certify a profitable strategy.
Frequently asked questions
Must every fair value gap be filled?
No such guarantee follows from the definition. A measured probability needs a fixed horizon, a complete sample and a stated meaning of fill.
Does a wick through the far edge invalidate the zone?
Not under this article’s close-based rule. Wick invalidation is a separate version and must be evaluated independently.
Research sources
Each source supports the definition or evidence described beside it. The pseudocode, synthetic examples and proposed parameters require separate validation.
- Fair Value GapLuxAlgo on TradingView. Read the published detector conditions; its fill rate was not independently tested. Checked: .
- RepaintingTradingView. Read documentation concerning unconfirmed data. Checked: .
- Futures Order TypesCME Group. Read exchange order mechanics to distinguish signals from fills. Checked: .
Related methods
Risk note
This content supports education and research design, not financial advice. Backtest is historical simulation, does not guarantee future performance and does not place real trades. Methods in this library are not automatically features available in the app. See methodology and learning center.
Validate rules before risking real capital
Check app support, data and individual simulated trades; advanced detectors may require a separate implementation.
Download Backtest on the App Store