Article contents
- Evidence and scope
- Illustration
- Process
- Understand the labels before interpreting the colors
- Separate diagonal comparisons from same-row ratios
- A six-row calculation and an invalidated cluster
- Continuation and failure need different state machines
- Historical replay must match live aggregation
- Test whether the stack adds more than high volume
- Common pitfalls
- Practical checklist
- Frequently asked questions
- Research sources
Evidence and scope
Sierra Chart documents Numbers Bars and diagonal bid/ask comparisons. TradingView describes an intrabar price-direction classification that is not automatically an exchange aggressor flag. Bybit supplies an example of a feed with taker-side semantics. No verified profitability is established here for the proposed 3× threshold. [1] [2] [3]
 Open full-size illustration
Practical workflow
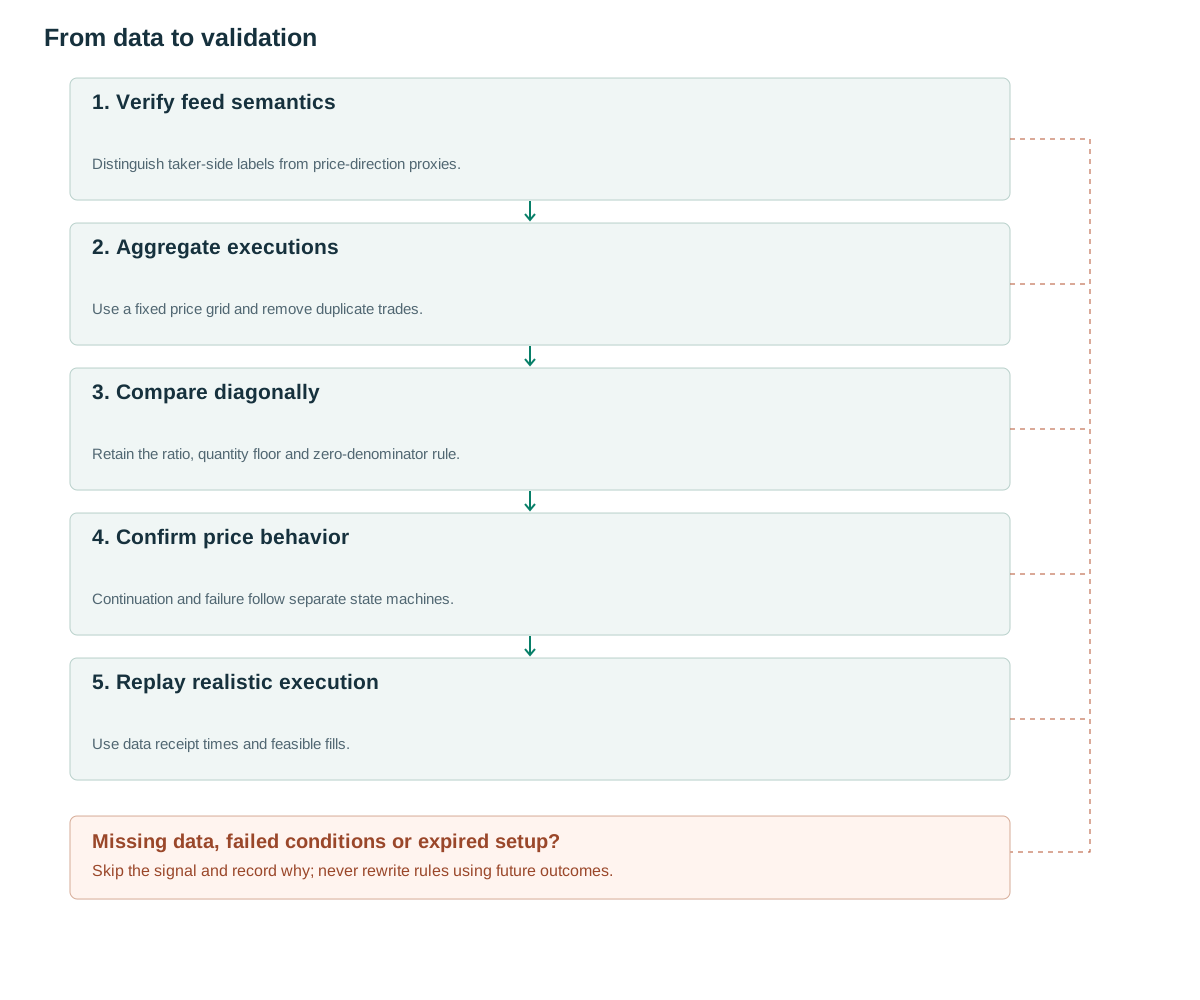
- Verify feed semanticsDistinguish taker-side labels from price-direction proxies.
- Aggregate executionsUse a fixed price grid and remove duplicate trades.
- Compare diagonallyRetain the ratio, quantity floor and zero-denominator rule.
- Confirm price behaviorContinuation and failure follow separate state machines.
- Replay realistic executionUse data receipt times and feasible fills.
Understand the labels before interpreting the colors
Ask volume commonly refers to buyer-initiated executions at the ask, while bid volume refers to seller-initiated executions at the bid. If the exchange supplies a taker-side field, follow that schema. If classification is inferred from quotes or a tick rule, preserve the inference method and an unknown category. Bybit publicTrade.S is documented as taker side in the source examined here. [3]
TradingView’s footprint classifies observations using intrabar price direction, and available historical granularity can vary. [2] Labels such as buy and sell therefore need not measure the same thing across platforms. A green candle with negative classified delta is not automatically erroneous: open-to-close movement and signed execution totals answer different questions.
Footprint records what traded. It does not reveal every resting order, the full queue ahead of an order, or hidden liquidity that never executed. A large aggressive-buying cluster may meet enough passive selling to halt price. Subsequent price response is required before treating that cluster as continuation or as a failed attempt.
Separate diagonal comparisons from same-row ratios
In the diagonal comparison described by Sierra Chart, ask volume at price p is compared with bid volume at the lower neighboring price; bid at p is compared with ask at the higher price. [1] This article uses one-tick rows and defines a bullish imbalance when ask[p] is at least 3×bid[p−tick], ask[p] is at least 30 units and the bid denominator is positive.
Three consecutive qualifying rows form a proposed stacked imbalance. The ratio, floor and required length are research settings, not validated universal constants. The minimum quantity must have a declared unit: 30 futures contracts, shares or cryptocurrency units have very different economic meanings.
When the counterpart denominator is zero, this version records a separate zero-counterpart state rather than automatically treating the ratio as infinite. A platform that permits zero denominators implements a different variant. Test it separately with an explicit minimum-volume floor so a tiny isolated execution cannot create an exaggerated signal.
Consecutive means adjacent price rows on the fixed grid. Missing or empty rows cannot be removed before searching for runs, because doing so can make separated imbalances look stacked. Preserve the grid and define whether the highest or lowest row needs a neighbor outside the displayed bar range.
for p in ordered_price_rows(closed_bar):
    a = ask_volume.get(p, 0)
    b = bid_volume.get(p-tick, 0)
    eligible[p] = b > 0 and a >= 30
    buy_imbalance[p] = eligible[p] and a >= 3*b
runs = consecutive_true_rows(buy_imbalance)
stack = first((run for run in runs if len(run) >= 3), default=None)
if stack is not None:
    zone_low, zone_high = row_bounds(stack)
    signal_available_at = closed_bar.received_at
A six-row calculation and an invalidated cluster
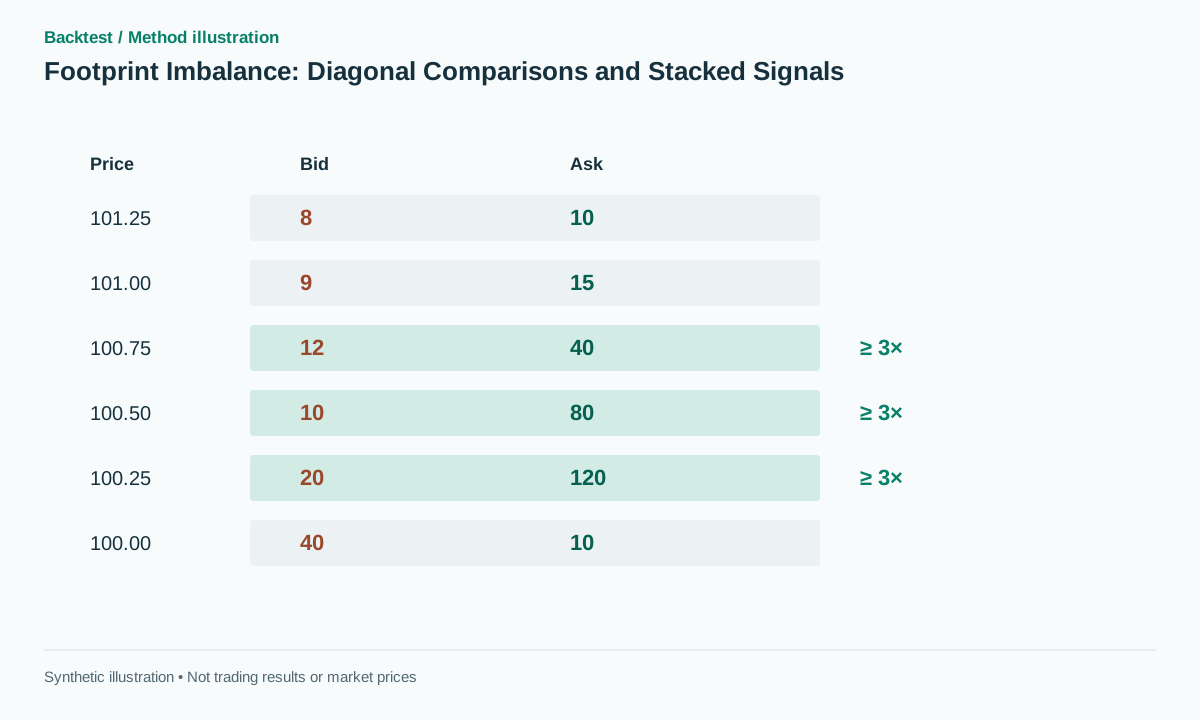
The synthetic rows contain bid/ask quantities of 40/10 at 100.00, 20/120 at 100.25, 10/80 at 100.50, 12/40 at 100.75, 9/15 at 101.00 and 8/10 at 101.25. Ask 120 at 100.25 compares with bid 40 at 100.00, giving 3×. Ask 80 compares with bid 20, giving 4×; ask 40 compares with bid 10, also giving 4×.
These three adjacent rows satisfy both the ratio and the 30-unit floor. Ask 15 at 101.00 fails the floor even if a smaller denominator might otherwise create a large ratio. The illustration uses these exact values so the highlighted stack can be checked manually.
For a failure case, suppose the aggressive-buying stack forms immediately below resistance, price fails to close above it and the next bar crosses below the cluster. This is compatible with an absorption hypothesis, but the footprint alone cannot identify the passive seller or guarantee a reversal.
A displayed 300% comparison is a ratio of two defined volume quantities, not a 75% probability of success. Converting a ratio into a trading probability would require an independently estimated conditional outcome distribution and its uncertainty.
Continuation and failure need different state machines
A proposed continuation-long requires a breakout of a previously frozen price level, a close above the region and a qualifying buy stack. Wait for the first retest within five bars that holds zone_low, then a close above the retest-bar high. Enter at the next executable event and place the stop below zone_low with a predefined buffer. Cancel if price closes below zone_low before confirmation.
A proposed failure-short instead requires the buy stack at resistance, a close back below the region and a break of the event low. Its stop is above the event high. Do not transform a losing long into a short within the same statistics unless the transition, execution timing and additional risk were specified before testing.
Both variants require applicable funding or borrowing costs and realistic fills. In a fast market, waiting for a complete bar can consume much of the move. This delay is part of the method, not a reason to assign an earlier fill using the final footprint that became visible later.
Record whether the zone spans row centers or full row boundaries. For the one-tick grid, define the lower and upper edges explicitly before setting a stop. A quarter-tick or one-tick discrepancy can meaningfully change the risk multiple when the proposed stop is tight.
Historical replay must match live aggregation
Store sequence identifiers, exchange timestamps, receipt timestamps, trade IDs and unclassified volume. Remove duplicates with a documented key and handle corrections under a point-in-time policy. If historical data use one-minute proxies while live signals use individual trades, the observations no longer have the same granularity or classification.
Replay from the same feed and aggregation rules before comparing profitability. A market-depth snapshot cannot exactly reconstruct all executions between snapshots. When sequence gaps occur, mark the affected bars and apply a predefined quality policy instead of inferring the missing trade sides from the outcome.
Changing ticks per row changes both the ratios and stack lengths. Freeze row size when a candidate is created and avoid automatic sizing based on the complete future dataset. If adaptive sizing is desired, define its historical window and availability lag as part of a separate strategy.
Use receipt time for decisions that must reflect network delay. Exchange timestamps are useful for ordering events but do not prove that a trader had already received them. Simulate delayed delivery and out-of-order messages to see whether a close-based signal remains reproducible.
Test whether the stack adds more than high volume
On identical price breakouts compare no footprint filter, total volume alone, delta alone and stacked imbalance. Keep entries and exits fixed, or explicitly separate a timing study from a selection study. Since stacks often occur in active bars, ask whether the spatial pattern adds information beyond the amount of activity.
Report net expectancy in R, missing-trade rate, no fills, drawdown and sensitivity to latency and spread. Select thresholds and quantity floors on training data, then lock the final chronological test. Include rejected candidates so reduced trade frequency is visible rather than hidden.
Correctly coloring a synthetic table verifies the arithmetic and renderer. It does not validate an executable strategy on real transaction data. A useful conclusion states the data classification, market, period, costs and failure conditions under which any observed improvement survives.
Common pitfalls
Assuming more green cells guarantees an advance
Aggressive buying can meet substantial passive selling; price response still matters.
Inferring the complete resting book
A footprint describes executions, not every outstanding order or queue position.
Testing proxies and trading a different live feed
Different resolution and classification can change signals even when the charts look similar.
Checklist before using this method
Check each item after verifying it on your data. Progress is saved in this browser; it does not certify a profitable strategy.
Frequently asked questions
Does 300% imbalance mean a 75% win probability?
No. It is a comparison of two volume quantities, not an estimated outcome probability.
Can ordinary OHLCV reconstruct an exact footprint?
No. It can support an approximation, but it does not reveal the precise trade-at-price distribution and aggressor classification.
Research sources
Each source supports the definition or evidence described beside it. The pseudocode, synthetic examples and proposed parameters require separate validation.
- Numbers BarsSierra Chart. Definitions of bid/ask volume and diagonal comparisons in Numbers Bars. Checked: .
- Volume footprint charts: a complete guideTradingView. Intrabar price-direction classification and historical granularity limitations. Checked: .
- Public TradeBybit. Trade identifiers, timestamps and taker-side schema; no strategy performance claim. Checked: .
Related methods
Risk note
This content supports education and research design, not financial advice. Backtest is historical simulation, does not guarantee future performance and does not place real trades. Methods in this library are not automatically features available in the app. See methodology and learning center.
Validate rules before risking real capital
Check app support, data and individual simulated trades; advanced detectors may require a separate implementation.
Download Backtest on the App Store