Article contents
- Evidence and scope
- Illustration
- Process
- Volume profile measures activity at price; TPO measures time visits
- Freeze the interval and price-row construction
- A value-area target is not a complete algorithm
- Six price rows expose the convention difference
- Acceptance and rejection are separate strategies
- Measure construction sensitivity before claiming an edge
- Common pitfalls
- Practical checklist
- Frequently asked questions
- Research sources
Evidence and scope
TradingView and Sierra Chart document profile construction and platform conventions. These sources explain tools, not verified profitability for the proposed acceptance and rejection rules. TPO is a different time-based representation and must not be substituted without changing the feature definition. [1] [2] [3]
 Open full-size illustration
Practical workflow
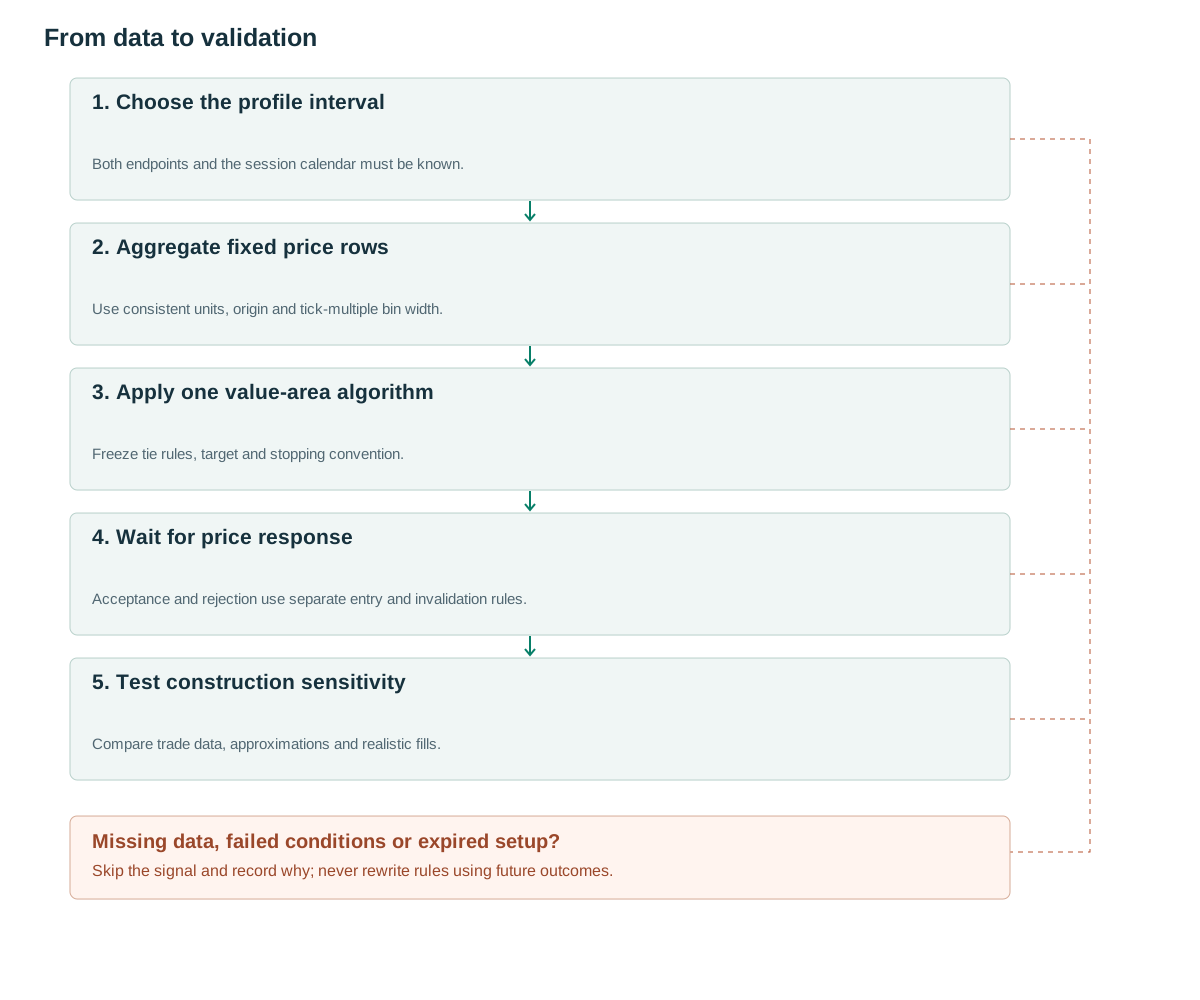
- Choose the profile intervalBoth endpoints and the session calendar must be known.
- Aggregate fixed price rowsUse consistent units, origin and tick-multiple bin width.
- Apply one value-area algorithmFreeze tie rules, target and stopping convention.
- Wait for price responseAcceptance and rejection use separate entry and invalidation rules.
- Test construction sensitivityCompare trade data, approximations and realistic fills.
Volume profile measures activity at price; TPO measures time visits
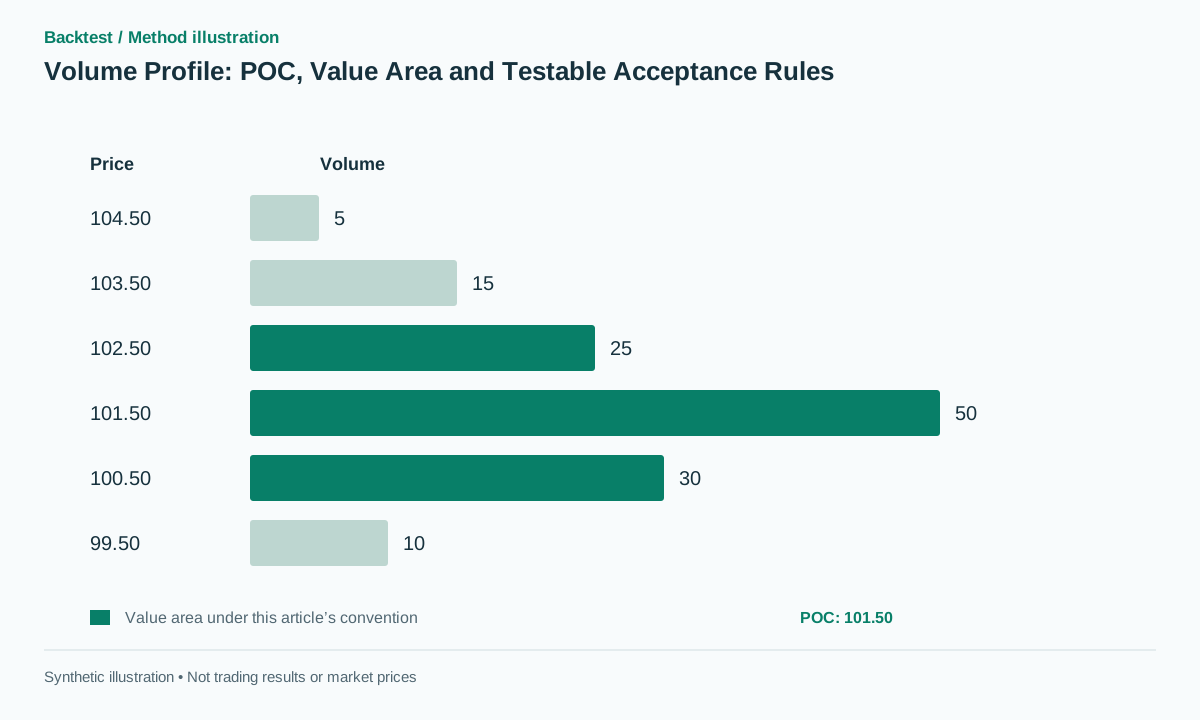
POC is the price row with the largest volume. The value area is a contiguous region around POC selected using a target fraction and an expansion algorithm; VAH and VAL are its upper and lower boundaries. High-volume and low-volume nodes describe relatively busy or sparse regions and need not coincide with the value-area edges. TradingView explains its use of lower-timeframe observations and up/down volume. [1]
TPO marks whether a price level was visited within a time block rather than counting traded quantity. [3] A level visited repeatedly with small transactions can accumulate many time opportunities but little volume. Replacing a volume POC with a TPO POC therefore changes the measured quantity, even when the chart labels look similar.
Neither representation reveals all future liquidity. Historical executed volume is different from current resting orders, and a heavily traded region does not establish who holds positions there now. Treat the profile as a recorded distribution to test against subsequent price behavior, not as a map of guaranteed institutional support.
Freeze the interval and price-row construction
Choose a completed previous session, a range with both endpoints already known, or a fixed rolling interval. A visible-range profile changes when the chart is zoomed and remains an exploratory tool unless the viewing window is made into an explicit rule. A developing profile uses only information available so far; a completed end-of-session profile cannot guide an opening trade earlier that same day. [2]
Bin width should be a multiple of tick size and fixed before the experiment. Assign price p using floor((p−origin)/bin_width). A fixed origin prevents a new high from shifting every historical bin boundary. Use consistent trade-size units, and do not combine coin quantity and dollar turnover across venues as though they were the same measurement.
Keep empty rows between traded levels because contiguity matters for value-area expansion. Dropping zero-volume rows can turn distant price regions into apparently adjacent bins. State how the exact upper boundary is assigned and use the same half-open interval convention in calculation, chart labels and order placement.
When reconstructing volume-at-price from aggregate bars, document the allocation approximation. OHLCV alone does not reveal the exact distribution of executions inside the range. Compare the approximation with trade data on an overlapping sample before assuming historical and live signals are equivalent.
A value-area target is not a complete algorithm
The proposed convention starts at POC, compares the neighboring rows and adds the larger-volume neighbor. Ties choose the upper row; a tied POC chooses the lowest price. Expansion continues until covered volume reaches or exceeds 70% of the total. These are explicit research conventions, not a claim that every platform calculates the same region.
The TradingView documentation examined for this article describes stopping before an added row would exceed the target. [1] Its result can therefore differ from the convention above. A reproduction of a particular platform must follow that platform’s actual rules, including its tie handling, row construction and version.
Require a nonempty histogram with positive total volume before selecting POC. If the session is incomplete or a data gap breaches the quality policy, return an unavailable profile. Do not manufacture missing executions or allow an empty histogram to produce a seemingly valid support level.
histogram = aggregate_trade_size_by_fixed_price_bin(trades_before_cutoff)
if len(histogram) == 0: return INSUFFICIENT_DATA
if any(not finite(v) or v < 0 for v in histogram): return INVALID_DATA
if sum(histogram) <= 0: return INSUFFICIENT_DATA
poc = first_lowest_price_argmax(histogram)
lo = hi = poc
covered = histogram[poc]
target = 0.70 * sum(histogram)
while covered < target:
    left = histogram[lo-1] if lo > 0 else -1
    right = histogram[hi+1] if hi+1 < len(histogram) else -1
    if right >= left:
        hi += 1; covered += histogram[hi]
    else:
        lo -= 1; covered += histogram[lo]
VAL, VAH = lower_edge(lo), upper_edge(hi)
freeze_profile(cutoff, bin_width, poc, VAL, VAH)
Six price rows expose the convention difference
The bins [99,100), [100,101), [101,102), [102,103), [103,104) and [104,105) contain volumes 10, 30, 50, 25, 15 and 5. Total volume is 135. POC is the [101,102) row, centered at 101.5. The 70% target is 94.5.
Under this article’s convention, begin with 50, add the lower neighbor of 30 to reach 80, then add the upper neighbor of 25 to reach 105. VAL=100 and VAH=103, with actual coverage of 105/135, or approximately 77.78%. Under a stop-before-exceeding convention, adding 25 is rejected and coverage remains 80/135, approximately 59.26%.
Both configurations can display a 70% setting while producing different boundaries. This does not mean either output has a 70% probability of reversal, containment or profit. The percentage describes a construction target for historical volume.
A failed-breakout example occurs when price rises above the frozen VAH of 103 and then falls to 102.5. Later substituting a developing VAH that has moved down to 102 rewrites the original reference. Preserve the profile snapshot attached to the candidate rather than judging old signals against a newly drawn region.
Acceptance and rejection are separate strategies
A proposed acceptance-long rule uses the frozen previous-session profile. Require two consecutive closes above VAH plus 0.1 ATR, then the first retest within five bars to hold above VAH−0.15 ATR and recover above the retest-bar high. Enter at the next executable event and place the stop below the retest low. This version skips a breakout that never retests.
A proposed rejection-short rule requires a high above VAH followed by a close back below it, then a break of the rejection-bar low. The stop is above the event high. A frozen POC may be a target only if its distance still offers the required reward relative to risk after the actual fill.
The two setups express opposing hypotheses and need separate state machines. A regime filter must be defined before the event rather than inferred from the eventual outcome. If a rejection trade becomes a continuation candidate, record a new event according to a predefined transition rule instead of relabeling a losing trade.
ATR buffers and the five-bar timeout are proposed settings. Test a small registered range, keep the final sample untouched and report skipped or expired opportunities. Slippage through a low-volume region may be especially important, but past sparse trading alone does not prove future poor liquidity.
Measure construction sensitivity before claiming an edge
On a segment with both data types, compare trade-based profiles with bar approximations. Measure how often POC or value-area boundaries change bins and how often candidate states change. Two charts that look similar can still generate different stops and entries near an edge.
Test a small predefined set of row widths using the same source, session and cutoff rules. Choose widths from tick economics rather than adjusting them to match support already visible on the chart. Compare a price-only baseline with additional distances to POC and value-area boundaries while keeping execution fixed.
Report missing-profile rates, no fills, spread, slippage, net expectancy and drawdown. A correct histogram validates a calculation; it does not validate a strategy. The useful research conclusion should state whether the feature survives realistic execution and reasonable construction choices, including cases where it adds no measurable benefit.
Common pitfalls
Using a final profile earlier in the session
The completed distribution includes executions that had not occurred at the decision time.
Treating all 70% value areas as identical
Expansion and stopping conventions can produce materially different edges.
Equating historical volume with resting liquidity
Executed activity does not reveal the complete current order book.
Checklist before using this method
Check each item after verifying it on your data. Progress is saved in this browser; it does not certify a profitable strategy.
Frequently asked questions
Is a volume profile the same as TPO?
No. One counts executed quantity at price; the other records price visits within time blocks.
Does a 70% value area predict a 70% return-to-value probability?
No. It is a historical construction target whose relationship to future price behavior must be tested.
Research sources
Each source supports the definition or evidence described beside it. The pseudocode, synthetic examples and proposed parameters require separate validation.
- Volume profile indicators: basic conceptsTradingView. POC, value area, lower-timeframe inputs and the documented expansion convention. Checked: .
- Volume By PriceSierra Chart. Profile configuration, volume-at-price and developing reference levels. Checked: .
- Time price opportunity charts explainedTradingView. TPO time-block visits and their distinction from volume histograms. Checked: .
Related methods
Risk note
This content supports education and research design, not financial advice. Backtest is historical simulation, does not guarantee future performance and does not place real trades. Methods in this library are not automatically features available in the app. See methodology and learning center.
Validate rules before risking real capital
Check app support, data and individual simulated trades; advanced detectors may require a separate implementation.
Download Backtest on the App Store