Article contents
- Evidence and scope
- Illustration
- Process
- Every contract has two sides
- Units and counting conventions belong in the feature definition
- Join snapshots as of the decision, not by nearest timestamp
- Outstanding stock and trading flow are different quantities
- Two price–OI hypotheses can be tested separately
- Validate the data before evaluating the filter
- Common pitfalls
- Practical checklist
- Frequently asked questions
- Research sources
Evidence and scope
CME explains OI versus volume. Bybit documentation illustrates product-specific units and counting fields. The Giagkiozis–Said abstract reports inconsistencies in a 2023 sample, not a verdict that every current feed is wrong. No new backtest validates the proposed filters here. [1] [2] [3]
 Open full-size illustration
Practical workflow
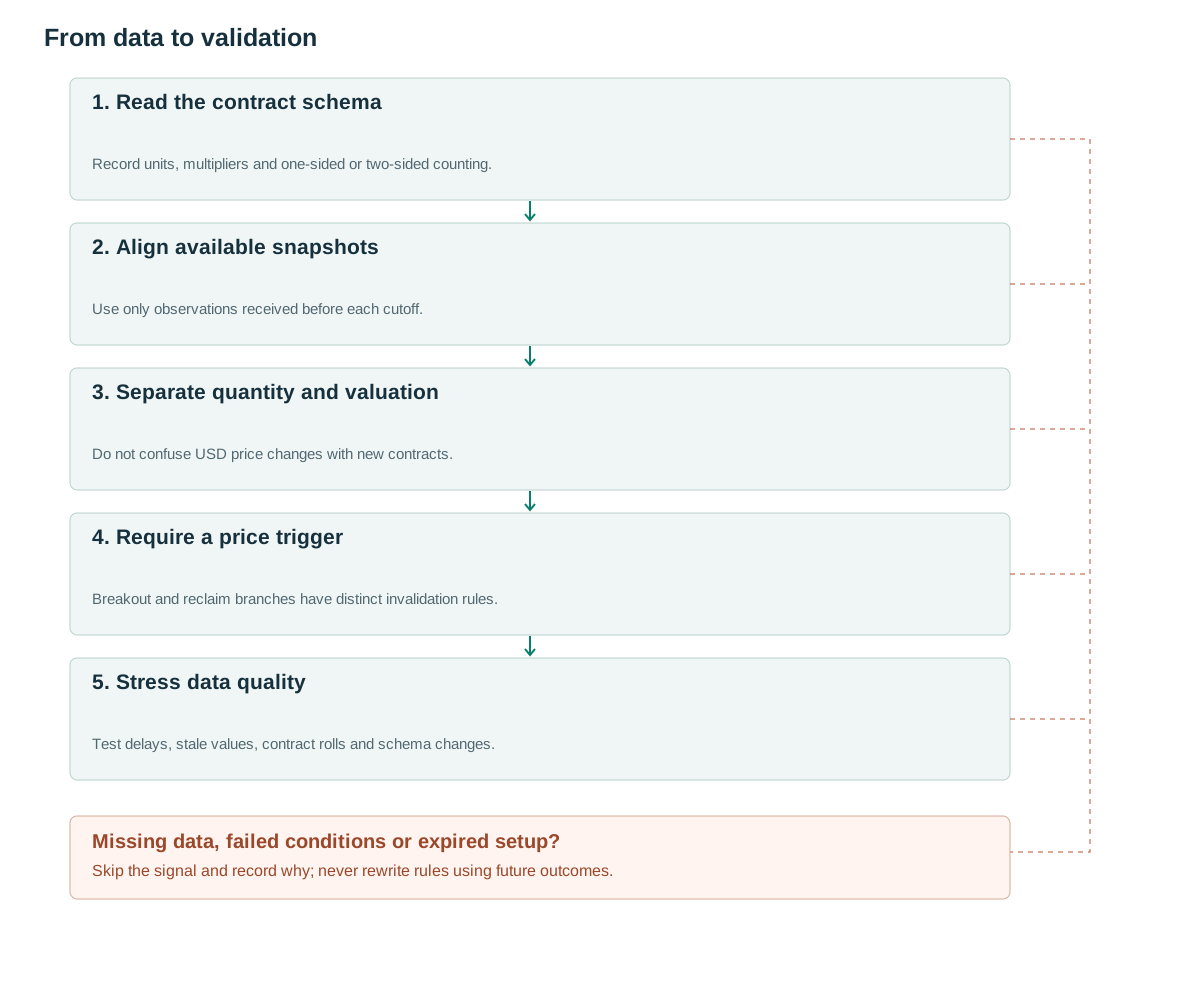
- Read the contract schemaRecord units, multipliers and one-sided or two-sided counting.
- Align available snapshotsUse only observations received before each cutoff.
- Separate quantity and valuationDo not confuse USD price changes with new contracts.
- Require a price triggerBreakout and reclaim branches have distinct invalidation rules.
- Stress data qualityTest delays, stale values, contract rolls and schema changes.
Every contract has two sides
Under a one-sided contract-count convention, a transaction in which both counterparties open new positions increases OI by one contract. If both close existing positions, OI decreases by one. If an opening position replaces a closing position, OI is unchanged. Trading volume increases in all three cases. CME distinguishes the stock of outstanding contracts from the flow of trading activity. [1]
Rising price with rising OI can accompany new position creation, but each contract still has two sides. Identifying which participants opened longs or shorts requires additional classified data. Falling price with falling OI can be consistent with deleveraging; it does not prove that every closed position was a liquidated long.
The familiar four combinations of price up/down and OI up/down are descriptions, not complete strategies. They omit entry timing, participant identity, hedging motives and execution costs. Treat each combination as a candidate explanatory feature whose future relationship must be estimated in the intended market.
Units and counting conventions belong in the feature definition
Read the contract multiplier, inverse or linear product type and API counting convention. The Bybit documentation examined here distinguishes openInterest counted across both sides from singleOpenInterest counted on one side; inverse products use USD units while linear products use coin units. [2] Preserve the field name and schema version rather than silently switching between fields in historical and live data.
USD-valued OI can rise because the underlying price rises while the number of coins or contracts remains unchanged. To study position creation, prefer a consistent quantity measure or decompose price and quantity effects. Do not add BTC quantities to ETH quantities. A cross-asset USD aggregate needs a stated valuation price and timestamp.
A change in contract specifications or a transition from one-sided to two-sided reporting can create a discontinuity unrelated to trading behavior. Detect and annotate such changes. A visually smooth normalization may hide the break while preserving a false percentage-change signal, so retain the raw field and conversion metadata.
For expiring futures, contract rolls also matter. A decline in the front contract may represent migration into the next contract rather than a reduction in the market’s aggregate exposure. Define whether the feature follows one named contract or a documented aggregation across eligible expiries.
Join snapshots as of the decision, not by nearest timestamp
Use the most recent snapshot actually received before the decision. A nearest-time join can select a future observation and leak information. Limit forward filling to a declared maximum age; stale OI can otherwise make an active market look unchanged. A robust dataset stores both the observation timestamp and the timestamp at which the value became available.
For a horizon comparison, retrieve the latest eligible quantity at the current cutoff and at the earlier cutoff. Require a positive previous quantity, consistent contract identity and acceptable age for both observations. The pseudocode checks both snapshots against their respective cutoffs.
Do not linearly interpolate between a known past snapshot and a future one to estimate an intraday value. That calculation is useful for retrospective visualization but not a causal input. If historical availability timestamps are absent, state the limitation and stress conservative publication delays rather than assuming immediate access.
Compute price change and traded volume over the matching horizon using their own availability rules. Save actual snapshot times because irregular updates mean two nominal five-minute comparisons may span different effective intervals. Reject or separately analyze observations with excessive alignment mismatch.
Measure each snapshot’s age against its own cutoff: the current value against t and the earlier value against t−horizon. Both must have compatible contract identity, units, multipliers and counting conventions; comparable_quantity_schema rejects an unhandled change. Age uses the observation timestamp, while received_at establishes whether the value had arrived.
at decision_time t:
    oi = latest_snapshot(received_at <= t, instrument=contract)
    prev = latest_snapshot(received_at <= t-horizon, instrument=contract)
    if missing(oi,prev): return INSUFFICIENT_DATA
    if stale(oi, asof=t, max_age=max_age): return INSUFFICIENT_DATA
    if stale(prev, asof=t-horizon, max_age=max_age): return INSUFFICIENT_DATA
    if not comparable_quantity_schema(oi,prev): return INCOMPATIBLE_DATA
    if prev.quantity <= 0 or oi.quantity < 0: return INVALID_DATA
    delta_oi = oi.quantity / prev.quantity - 1
    delta_price = last_known_price(t) / last_known_price(t-horizon) - 1
    volume = sum(trade.size for trade in contract_trades
                 if t-horizon < trade.exchange_time <= t
                 and trade.received_at <= t)
    emit_features(delta_oi,delta_price,volume,oi.schema_version)
Outstanding stock and trading flow are different quantities
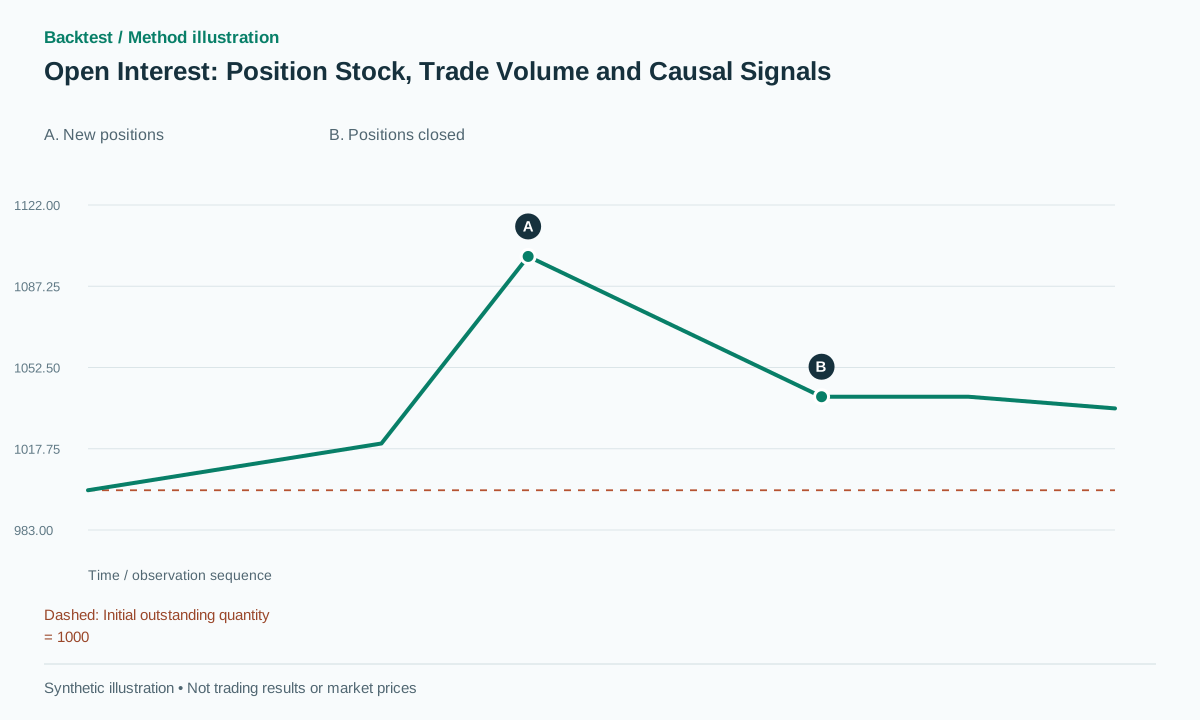
Start with OI of 1,000 contracts under the one-sided convention. A transaction involving 100 contracts with both parties opening raises OI to 1,100 and adds 100 to volume. A later 60-contract transaction with both sides closing reduces OI to 1,040 and adds another 60 to volume. Total traded volume is 160 while net OI change is only 40.
For a valuation counterexample, quantity remains 100 BTC while price rises from 50,000 to 55,000. USD notional rises from 5 million to 5.5 million, a 10% increase with no change in quantity. A filter calling this a 10% increase in new contracts would be incorrectly attributing a valuation effect to position creation.
For a timing failure, using a 10:05 OI snapshot to justify a 10:00 entry is invalid even if the final file is neatly sorted by observation time. Interpolating between 09:55 and 10:05 also leaks the future snapshot into the 10:00 feature. Sorting does not repair availability.
The chart illustrates quantity increasing and then decreasing. It does not identify the participants, distinguish voluntary exits from forced liquidation or show an investment return. Those conclusions require other observations and a separately defined research question.
Two price–OI hypotheses can be tested separately
A proposed breakout-continuation branch starts from a frozen price candidate and a close above resistance. Test positive quantity-based OI change over a fixed horizon, then test high RVOL as an additional filter. Horizon and threshold are research choices. Entry follows confirmation and the stop comes from price structure; OI does not independently supply a valid stop location.
A proposed washout-reclaim branch requires a sweep below a low, a meaningful decline in OI quantity and a price reclaim. Wait for subsequent price confirmation before entering long. Cancel on structural invalidation or timeout instead of buying solely because OI fell. A 5% or 10% decline is not a universal market constant.
If liquidation data are added, distinguish the side of the position being liquidated from taker side in the trade feed. Their labels can refer to different objects. A closing long, for example, should not be interpreted by simply copying a Buy label from one API into the semantics of another.
Keep the branches separate from the start. If a breakout fails while OI falls, it does not automatically become a successful washout experiment. A new candidate needs its own event time, confirmation and risk rule. Preserve the failed original candidate in the evaluation log.
Validate the data before evaluating the filter
Giagkiozis and Said examine tick data from two periods in 2023 across seven exchanges and report OI and liquidation inconsistencies. The reading scope here is the abstract of the revised paper, not a reproduction of its dataset. [3] It motivates checking snapshots, trades and schemas, but does not justify rejecting every current exchange feed.
Compare the same price detector with and without OI, then add RVOL or liquidation features one at a time. Inspect publication lag, stale-value rates, contract rolls and API changes. Include funding, spread, slippage and applicable borrowing costs, and stress an additional snapshot-cycle delay.
Report net expectancy, trade count, drawdown and opportunities rejected because data were unavailable. A filter that works only with later-corrected OI values is not demonstrably executable at the original time. A useful finding may be that data quality or reporting delay overwhelms any apparent predictive benefit.
Common pitfalls
Notional OI rises solely because price rises
USD valuation contains a price component; isolate quantity before interpreting new position creation.
Every decline is called liquidation
Voluntary position closing also reduces OI; liquidation needs a separate event feed.
Spot volume is substituted for perpetual OI
These are different markets and different quantities whose alignment must be explicit.
Checklist before using this method
Check each item after verifying it on your data. Progress is saved in this browser; it does not certify a profitable strategy.
Frequently asked questions
Is increasing OI inherently bullish?
No. Each contract has both sides. Directional usefulness depends on price context, data semantics and empirical validation.
Can end-of-day OI guide earlier intraday entries?
Only after its actual publication time. Assigning the final value to every earlier bar creates look-ahead bias.
Research sources
Each source supports the definition or evidence described beside it. The pseudocode, synthetic examples and proposed parameters require separate validation.
- Open InterestCME Group. Definition of outstanding contracts and their distinction from trading volume. Checked: .
- Get Open InterestBybit. Product units, counting fields and update caveats; retain the version used in implementation. Checked: .
- Reconciling Open Interest with Traded Volume in Perpetual SwapsGiagkiozis and Said. The revised abstract and its 2023 sample scope were examined; no independent reproduction was run. Checked: .
Related methods
Risk note
This content supports education and research design, not financial advice. Backtest is historical simulation, does not guarantee future performance and does not place real trades. Methods in this library are not automatically features available in the app. See methodology and learning center.
Validate rules before risking real capital
Check app support, data and individual simulated trades; advanced detectors may require a separate implementation.
Download Backtest on the App Store