Article contents
- Evidence and scope
- Illustration
- Process
- Three different questions about volume
- Align the calendar before dividing
- Calculation and information availability
- Numerical example and a misleading baseline
- Attach RVOL to a price candidate and an order rule
- Measure the incremental value of volume
- Common pitfalls
- Practical checklist
- Frequently asked questions
- Research sources
Evidence and scope
TradingView documents time-matched relative volume. The ORB paper uses one specific version for stock selection; a result for that complete strategy does not establish the independent value of an RVOL threshold. Median-based and benchmark-relative variants below require separate tests. [1] [2]
 Open full-size illustration
Practical workflow
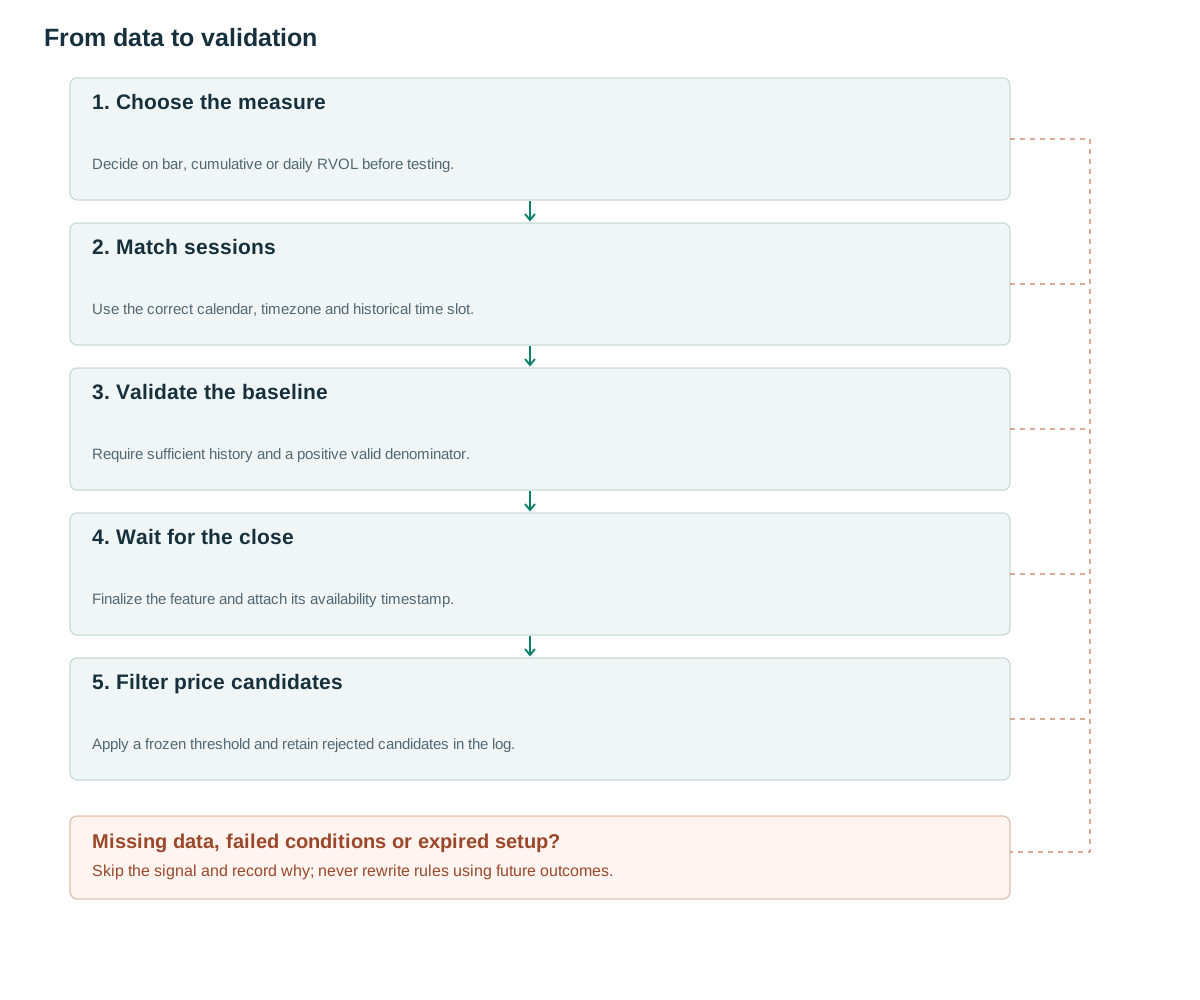
- Choose the measureDecide on bar, cumulative or daily RVOL before testing.
- Match sessionsUse the correct calendar, timezone and historical time slot.
- Validate the baselineRequire sufficient history and a positive valid denominator.
- Wait for the closeFinalize the feature and attach its availability timestamp.
- Filter price candidatesApply a frozen threshold and retain rejected candidates in the log.
Three different questions about volume
Bar RVOL measures an immediate burst of activity. Cumulative RVOL measures participation from the session start through the current time. Daily RVOL measures a completed session. Choose the quantity to match the research question: an individual breakout might use the event bar, while stock selection for a trading day might use cumulative participation. Do not switch definitions after observing which one produced the better result.
TradingView describes a historical average at corresponding times. [1] A median over 20 sessions is a proposed alternative intended to reduce the influence of exceptional observations. Means and medians can rank the same stocks differently, so record both the baseline estimator and its sample length in each signal.
High volume does not establish direction. It can accompany continuation, rejection, news or forced liquidation. A price detector must specify the location and subsequent response that distinguish these hypotheses. RVOL also cannot identify the participants as institutions: it observes activity, not account identity.
Align the calendar before dividing
For US stocks, use the exchange calendar and America/New_York to match the 09:30–09:35 interval across sessions. A fixed UTC interval drifts relative to the open when daylight-saving time changes. Separate regular and extended hours, shortened sessions and incomplete feeds. For continuous cryptocurrency trading, declare the daily boundary explicitly. Hour-of-week normalization can be a separate experiment if enough complete weeks exist.
The denominator contains previous sessions only. A zero baseline or insufficient valid history produces insufficient_data, not an arbitrarily enormous RVOL. Missing observations and genuine zero-volume intervals are different states. The source-quality research in [3] motivates checking venue data, but does not prescribe a universal correction for every exchange.
Save the actual list of baseline sessions. If a holiday or outage is omitted, another researcher should be able to reconstruct which observation replaced it. A selection rule that takes the previous 20 valid sessions is different from one that takes 20 calendar days and silently drops missing rows. Either can be studied, but they should not share a configuration identifier.
Calculation and information availability
The pseudocode uses a mean over 20 sessions as an independently specified baseline. A reproduction of the ORB paper must retain its 14-session definition. [2] A developing bar has provisional volume; its completed total is unavailable until the bar closes. The timestamp returned with the feature is part of the output, not an optional chart annotation.
Cumulative RVOL is the ratio of cumulative quantities, not the average of individual bar RVOL values. Those expressions weight the day differently. Sum each historical session through the matching slot first, then calculate the baseline across sessions. When a denominator sample is invalid, handle that session consistently for the complete cumulative observation.
on_closed_bar(d, k):
    history = previous_valid_sessions(d, count=20)
    if len(history) != 20: return INSUFFICIENT_DATA
    if not complete_valid_slots(history + [d], through=k):
        return INSUFFICIENT_DATA
    assert same_session_slot(history, k)
    base = mean(V[j,k] for j in history)
    cum_base = mean(sum(V[j,0:k+1]) for j in history)
    if base <= 0 or cum_base <= 0: return INSUFFICIENT_DATA
    rvol_bar = V[d,k] / base
    rvol_cum = sum(V[d,0:k+1]) / cum_base
    signal_at = bar_close_time(d,k)
    return rvol_bar, rvol_cum, signal_at
Numerical example and a misleading baseline
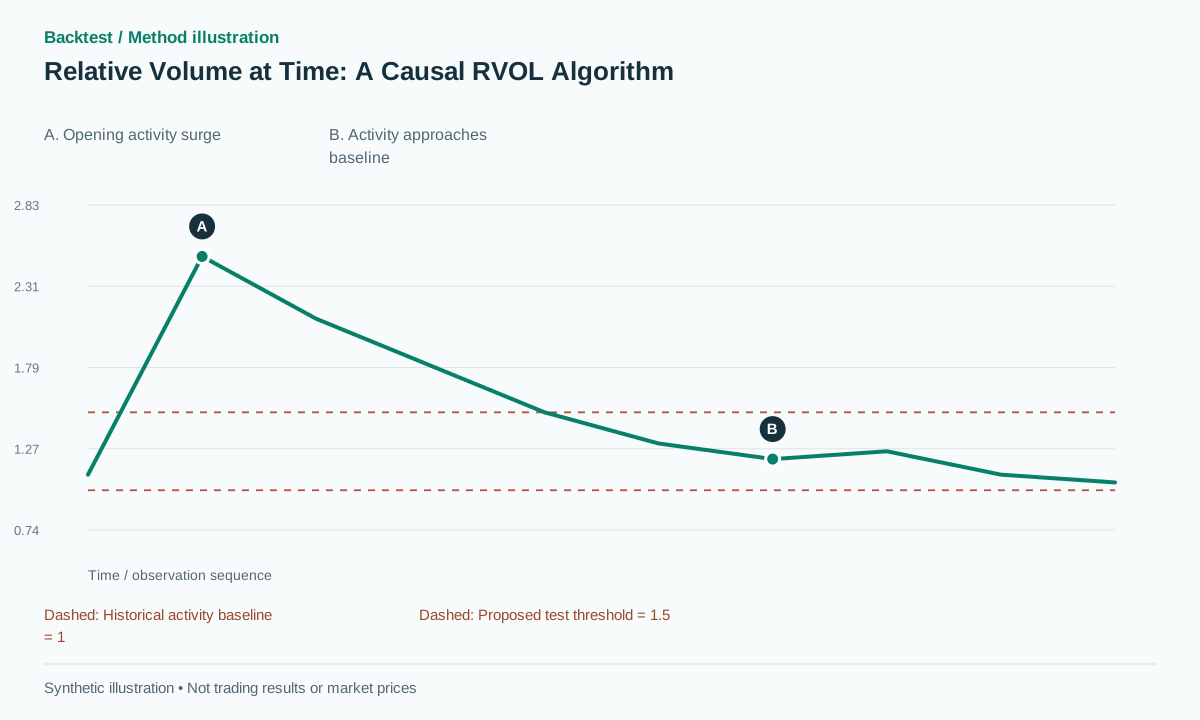
Suppose historical volume for 09:30–09:35 averages 100,000 shares and today reaches 250,000. Bar RVOL is 2.5. By 10:00, current cumulative volume is 600,000 versus a historical cumulative baseline of 500,000, so cumulative RVOL is 1.2. Activity has cooled relative to its normal path, even though absolute cumulative volume keeps increasing.
If average daily volume is 5 million, 600,000 divided by 5 million is 0.12: the stock has traded 12% of an average complete day. That is not the same metric as time-matched RVOL of 1.2. On a broad market event day, stock RVOL of 2 and benchmark RVOL of 3 produce a difference of −1 but a ratio of approximately 0.667. The subtraction and division variants have different meanings and scales.
A failure example is a feed that omitted half the historical opening volume. Its denominator falls from 100,000 to 50,000 and the same current observation is reported as RVOL 5. The scanner has selected a data defect, not a stronger opportunity. The illustration plots a synthetic RVOL series rather than a price series.
Attach RVOL to a price candidate and an order rule
One proposed experiment first defines a breakout above the highest high of the previous 20 completed bars. Once a close exceeds the frozen level, apply time-matched RVOL ≥1.5. This threshold is a research parameter. Submit an order at the next feasible event after the confirming close; do not assign a fill to the earlier breakout touch when final bar volume was still unknown.
RVOL does not define a stop. A study can place the stop below a previously identified retest low, impose portfolio risk limits and reject a new order when spread is too large relative to stop distance. If a stop-market order was already resting before a gap, however, it must receive the feasible triggered fill. Final volume cannot retrospectively delete a losing trade.
Distinguish selection from timing. Choosing a stock at 09:35 using its completed opening range is valid for subsequent events. Labeling it a high-RVOL stock at 09:31 using the eventual five-minute total is not. If the intended system trades during the opening range, construct a separate elapsed-time feature and acquire intrabar history capable of reproducing it.
Measure the incremental value of volume
Freeze one set of price candidates and compare four branches: price only, bar RVOL, cumulative RVOL and benchmark-relative RVOL. Keep entries, exits and sizing identical when testing selection. Count rejected opportunities as well as executed trades; otherwise the report hides the opportunity cost of the filter.
Evaluate separate periods, liquidity groups and times of day. Report net expectancy in risk units, trade count, return per day, drawdown and execution costs. A filter can raise win rate by eliminating most trades while reducing total performance. Lock thresholds before the final test, then monitor the same rules with actual data-receipt timestamps.
Useful implementation checks include a constant historical baseline, a zero-volume denominator, an incomplete shortened session and a daylight-saving transition. Append future sessions to a fixed historical prefix: previously emitted feature values and signals must remain unchanged. Also compare mean and median versions on an intentionally extreme prior session so that an accidental estimator substitution is visible.
For cross-sectional ranking, preserve the universe as it existed at the decision time and the tie-breaking rule for equal RVOL. Do not select a fixed list of today’s liquid survivors to represent earlier markets. If only fewer than the desired number of stocks have valid history, retain that smaller set or apply a predetermined allocation rule; inventing missing history conceals a real implementation constraint.
Common pitfalls
Rolling bars are not matching clock times
A rolling average of 78 five-minute bars mixes the open and midday. Treat it as a different feature.
High volume means buy
RVOL has no directional sign. A price trigger, invalidation and exit remain necessary.
Clean the sample using profit outcomes
Data exclusions must be specified before evaluation and must not depend on whether a trade won.
Checklist before using this method
Check each item after verifying it on your data. Progress is saved in this browser; it does not certify a profitable strategy.
Frequently asked questions
What RVOL value is good?
There is no universal threshold. A value such as 1.5 is a candidate research parameter whose meaning depends on the session, market, estimator and costs.
Can an unfinished bar be used?
Yes, with a separately defined elapsed-time feature compared against matching historical elapsed time. The backtest must have adequate intrabar data.
Research sources
Each source supports the definition or evidence described beside it. The pseudocode, synthetic examples and proposed parameters require separate validation.
- Relative Volume at TimeTradingView. Definition of ordinary and cumulative volume relative to corresponding historical times. Checked: .
- A Profitable Day Trading Strategy For The U.S. Equity MarketZarattini, Barbon, Aziz. Primary source for the ORB study’s five-minute, 14-session RVOL selection; not a validation of this article’s proposed variants. Checked: .
- Crypto Wash TradingNBER. Research information on reported volume quality in historical exchange samples; no extrapolation to every present-day venue. Checked: .
Related methods
Risk note
This content supports education and research design, not financial advice. Backtest is historical simulation, does not guarantee future performance and does not place real trades. Methods in this library are not automatically features available in the app. See methodology and learning center.
Validate rules before risking real capital
Check app support, data and individual simulated trades; advanced detectors may require a separate implementation.
Download Backtest on the App Store