Article contents
- Evidence and scope
- Illustration
- Process
- Shape needs a location and an information boundary
- Normalize body, wick and closing location
- Numerical qualification and failure examples
- Choose the entry before observing the subsequent path
- High volume establishes activity, not its cause
- Test context and execution without selecting attractive pictures
- Common pitfalls
- Practical checklist
- Frequently asked questions
- Research sources
Evidence and scope
TradingView describes hammer and shooting-star patterns, while TA-Lib implements one hammer convention. The numerical rejection-candle thresholds below are independent research proposals without a profitability claim.
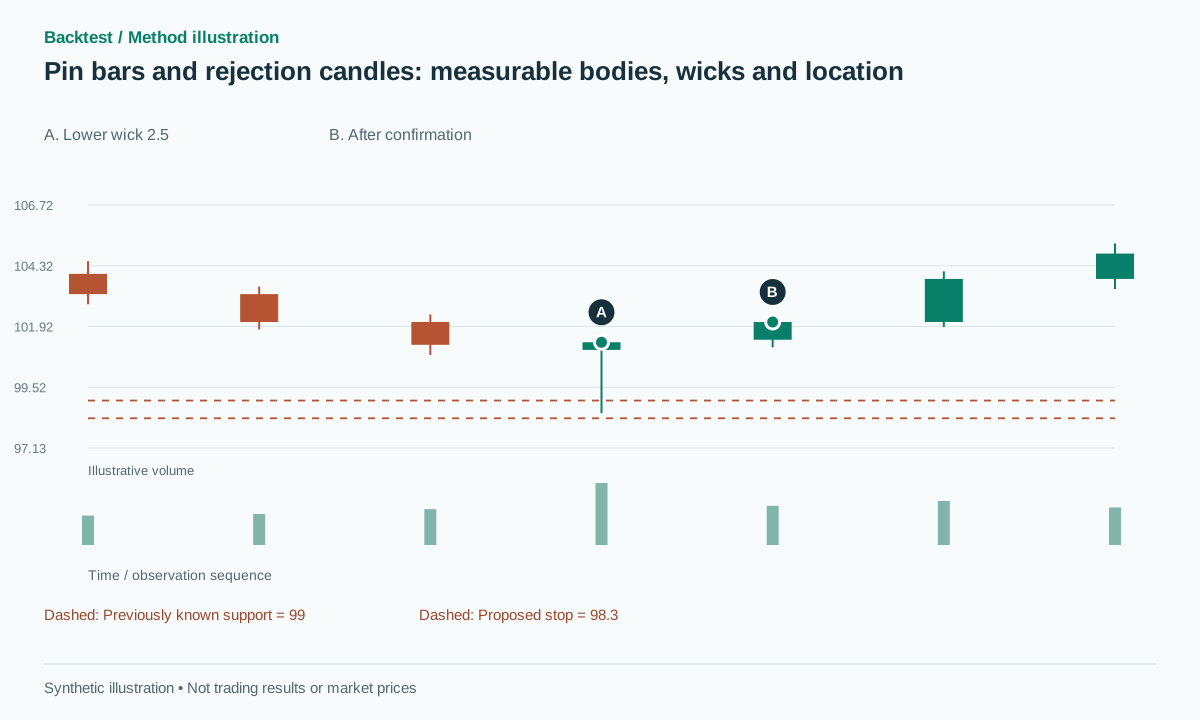 Open full-size illustration
Practical workflow
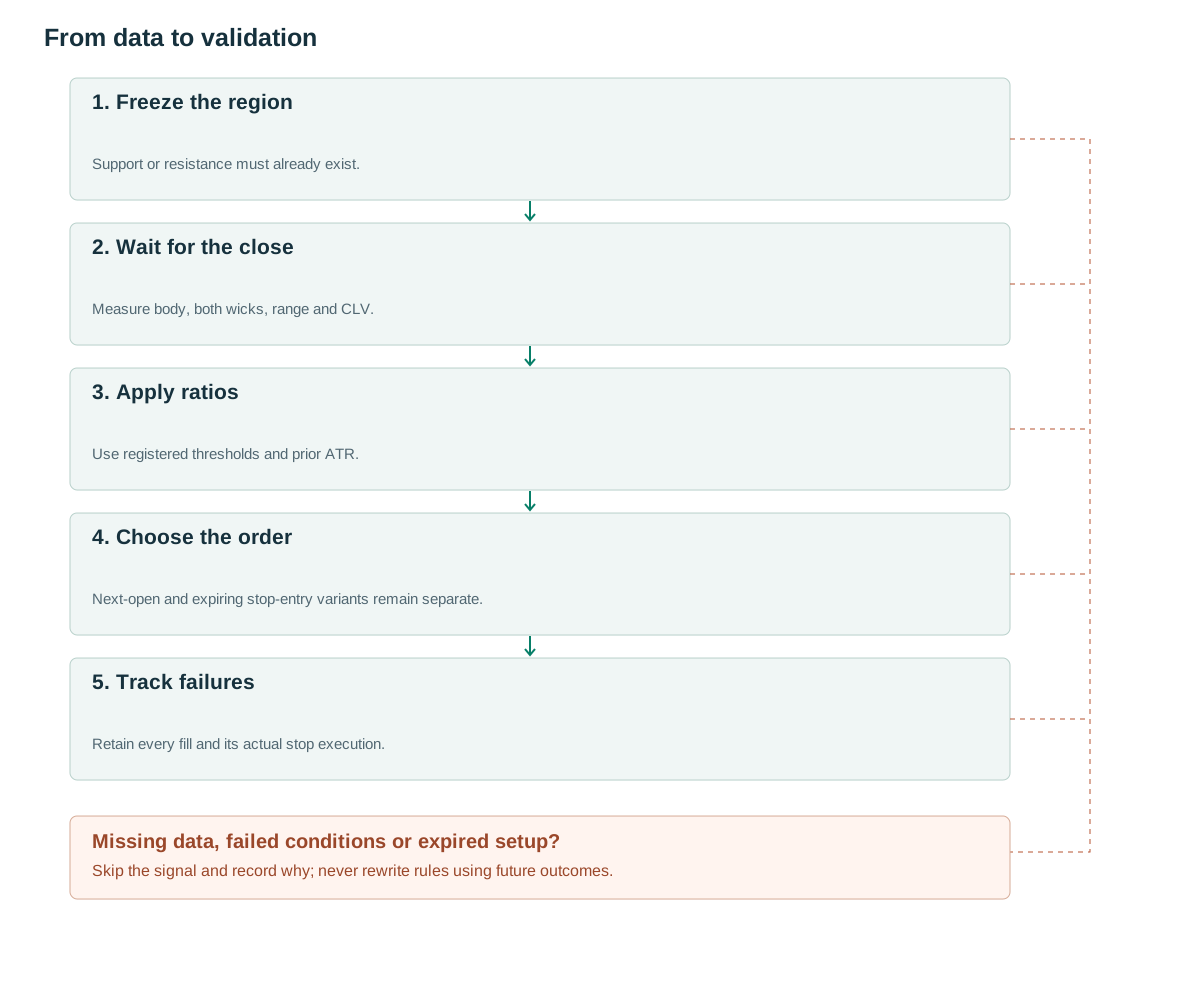
- Freeze the regionSupport or resistance must already exist.
- Wait for the closeMeasure body, both wicks, range and CLV.
- Apply ratiosUse registered thresholds and prior ATR.
- Choose the orderNext-open and expiring stop-entry variants remain separate.
- Track failuresRetain every fill and its actual stop execution.
Shape needs a location and an information boundary
TradingView's hammer and shooting-star descriptions include trend context [1][2]. Pin bar is a broader practitioner label. This article uses bullish rejection and bearish rejection for the proposed formulas rather than treating every long wick as an identical classical candle pattern.
The same OHLC values can result from different paths: price may fall first and recover, or rise, fall and recover again. The detector knows only the completed shape. Claims about aggressive buyers, resting sellers or stop cascades require additional data and a separate inference process.
Location must be established before the candle. A pre-existing support region can give a lower wick a specific research meaning: price traded below or within that reference and closed nearer the top of the range. Drawing support afterward from future pivots makes the apparent context unavailable at the decision time.
Keep the geometric label separate from the trade. A valid rejection candle in the middle of a range can be recorded without satisfying the location filter. This preserves a control group for determining whether the zone contributes anything beyond the candle ratios themselves.
Normalize body, wick and closing location
Let R=H−L, B=|C−O|, LW=min(O, C)−L, UW=H−max(O, C) and CLV=(C−L)/R. Reject R=0. Proposed bullish conditions are R≥0.8×ATR[t−1], LW/R≥0.55, B/R≤0.30 and CLV≥0.70, with the low testing a support zone that existed before the bar.
For a bearish rejection, substitute UW for LW, require CLV≤0.30 and use resistance. These thresholds are experimental settings. TA-Lib uses its own averaged candle settings [3], so its hammer output need not match this ratio-based definition. Keep implementation names and versions distinct.
The geometry already constrains several quantities: a very long lower wick and a high close leave limited room for the body and upper wick. Do not count each satisfied inequality as independent evidence. They jointly describe a shape rather than four separate predictive indicators.
Check input consistency before computing ratios. Require H≥max(O, C) and L≤min(O, C), respect tick precision and reject malformed bars. ATR is taken before the candle so an extreme rejection bar cannot enlarge its own denominator and make its relative size appear ordinary.
on_closed_bar(t):
    R = H[t]-L[t]
    if R <= 0 or ATR[t-1] <= 0: return
    bull = R >= 0.8*ATR[t-1]
    bull &= (min(O[t],C[t])-L[t])/R >= 0.55
    bull &= abs(C[t]-O[t])/R <= 0.30
    bull &= (C[t]-L[t])/R >= 0.70
    bull &= intersects_preexisting_support(L[t],H[t])
    if bull: freeze_setup(t, stop=L[t]-buffer, expires=t+3)
# Choose trigger and order type in advance; submit only after close t.
Numerical qualification and failure examples
Synthetic candle: O=101, H=101.5, L=98.5, C=101.3, with prior ATR=2. Range is 3, body is 0.3, lower wick is 2.5 and CLV is approximately 0.933. The ratios pass, and the low crosses previously known support at 99. The candidate becomes available after the close, not while price is trading at 98.5.
If C instead recovers only to 99.8 while the other values remain unchanged, CLV is approximately 0.433 and body/range is 0.40. The candle fails the proposed conditions despite retaining a visible lower wick. A visual impression of rejection does not override the numerical definition.
A different failure begins with a valid candle, entry at 101.4 and a later decline through a stop at 98.3. The wick does not prevent a second downside break. If the stop fills below 98.3 after a gap, the realized loss exceeds the initial price-risk estimate.
For boundary fixtures, set LW/R exactly to 0.55 and just below it, then mirror all prices around a fixed center to obtain a bearish case. The mirrored classification should be symmetric after rounding. Include dojis, zero-range bars and a candle extending through both support and resistance to check ambiguous context.
Choose the entry before observing the subsequent path
The proposed baseline enters at the next executable open, uses stop=L−buffer and targets 2R. With entry 101.4 and stop 98.3, price risk is 3.1 and the target is 107.6. A synthetic path reaching that target first is a successful rule outcome, but the chart below shows only the initial recovery and is not a historical backtest.
A separate buy-stop variant places an order above high+buffer with a three-bar TTL. It may remain unfilled if the market drops, or fill before a later reversal. An invalidation observed while the order is genuinely still unfilled can cancel it under a fixed rule. Once filled, the order cannot be deleted because the eventual close looks unfavorable.
If entry and stop are both crossed inside one bar, use finer data or a declared adverse ordering assumption. A completed OHLC candle cannot tell whether the entry occurred before or after the low. Report this ambiguity rather than selecting the winning order of events.
A longer wick often increases the structural stop distance. Quantity should fall when a fixed risk budget meets a larger distance, subject to costs and liquidity caps. Moving the stop into the candle body solely to make the displayed reward-to-risk more attractive creates a different strategy with different failure behavior.
High volume establishes activity, not its cause
High RVOL indicates unusual executed activity relative to the chosen baseline. It cannot distinguish news trading, stop execution, rebalancing or absorption from OHLCV alone. A low-volume long wick can instead reflect a thin market or wide spread, so a separate minimum-liquidity requirement may be necessary.
Test three branches: candle geometry only, geometry at a pre-existing zone, and then an added RVOL filter. RVOL≥1.5 is an experimental threshold. Normalize intraday activity by comparable session times and store the spread at the actual entry so the volume filter's execution consequences remain visible.
The rejection candle's full volume is known only after it closes. A strategy entering before the close cannot use that final volume as an admission condition. Such an anticipatory strategy needs partial-volume features and a matching partial historical baseline.
Do not assign the entire candle's volume to its wick or to support at 99. The bar may contain trading at many prices. If a hypothesis specifically concerns volume transacted below a level, it requires trade-level data or an explicitly disclosed approximation.
Test context and execution without selecting attractive pictures
Define the zone before the candle, for example from two already-confirmed independent pivots. Report results at zones versus in the middle of a range, with prior trend and range/ATR groupings established on development data. Do not manually collect only candles that look persuasive after their outcomes are known.
Test bullish and bearish symmetry, dojis, zero range, large tick sizes, missing bars and candles crossing both contextual boundaries. Compare batch results with incremental replay so a still-forming wick never appears as a completed historical signal.
Report net expectancy, drawdown, candidate count, rejection reasons and stop-entry fill ratio. If a filter raises win rate by discarding nearly all opportunities, examine its uncertainty and portfolio effect rather than declaring the added condition successful.
Stress next-open gaps, one-bar processing delay and spread changes around news. A pattern can remain geometrically identical while its executable entry becomes materially worse. That difference belongs in the strategy assessment, not in retrospective redrawing of the candle.
Common pitfalls
Calling every long wick absorption
OHLCV cannot establish aggressive trade direction and passive liquidity behavior by itself.
Using support constructed after the pattern
A zone requiring future pivots leaks unavailable contextual information.
Choosing the best entry for each trade
Next-open and resting-stop entries must be evaluated as distinct registered versions.
Checklist before using this method
Check each item after verifying it on your data. Progress is saved in this browser; it does not certify a profitable strategy.
Frequently asked questions
Must a bullish pin bar close above its open?
Not in this proposed formula. Closing location and body/wick ratios determine the label. Requiring C>O is an additional filter to test.
Is a longer wick always better?
No. An extreme wick may require an uneconomic stop distance or reflect poor liquidity. Evaluate size relative to ATR and the attainable fill.
Research sources
Each source supports the definition or evidence described beside it. The pseudocode, synthetic examples and proposed parameters require separate validation.
- Hammer - BullishTradingView. Read hammer morphology and trend context. Checked: .
- Shooting Star - BearishTradingView. Read shooting-star morphology and context. Checked: .
- TA-Lib CDLHAMMERTA-Lib. Read body/wick conditions and candle settings; source code was not copied. Checked: .
Related methods
Risk note
This content supports education and research design, not financial advice. Backtest is historical simulation, does not guarantee future performance and does not place real trades. Methods in this library are not automatically features available in the app. See methodology and learning center.
Validate rules before risking real capital
Check app support, data and individual simulated trades; advanced detectors may require a separate implementation.
Download Backtest on the App Store