Article contents
- Evidence and scope
- Illustration
- Process
- A zone represents observations already known
- Bound the entire cluster rather than linking a chain
- Numerical zone construction and a losing reclaim
- Count independent visits rather than consecutive bars
- Breakouts and reactions need distinct strategy rules
- Candle volume is not volume traded at the zone
- Test zone history and its actual opportunity set
- Common pitfalls
- Practical checklist
- Frequently asked questions
- Research sources
Evidence and scope
CME supplies support/resistance context, scikit-learn defines linkage concepts, and Osler's FX research discusses stop cascades. None validates the profitability of the proposed sequential clustering detector.
 Open full-size illustration
Practical workflow
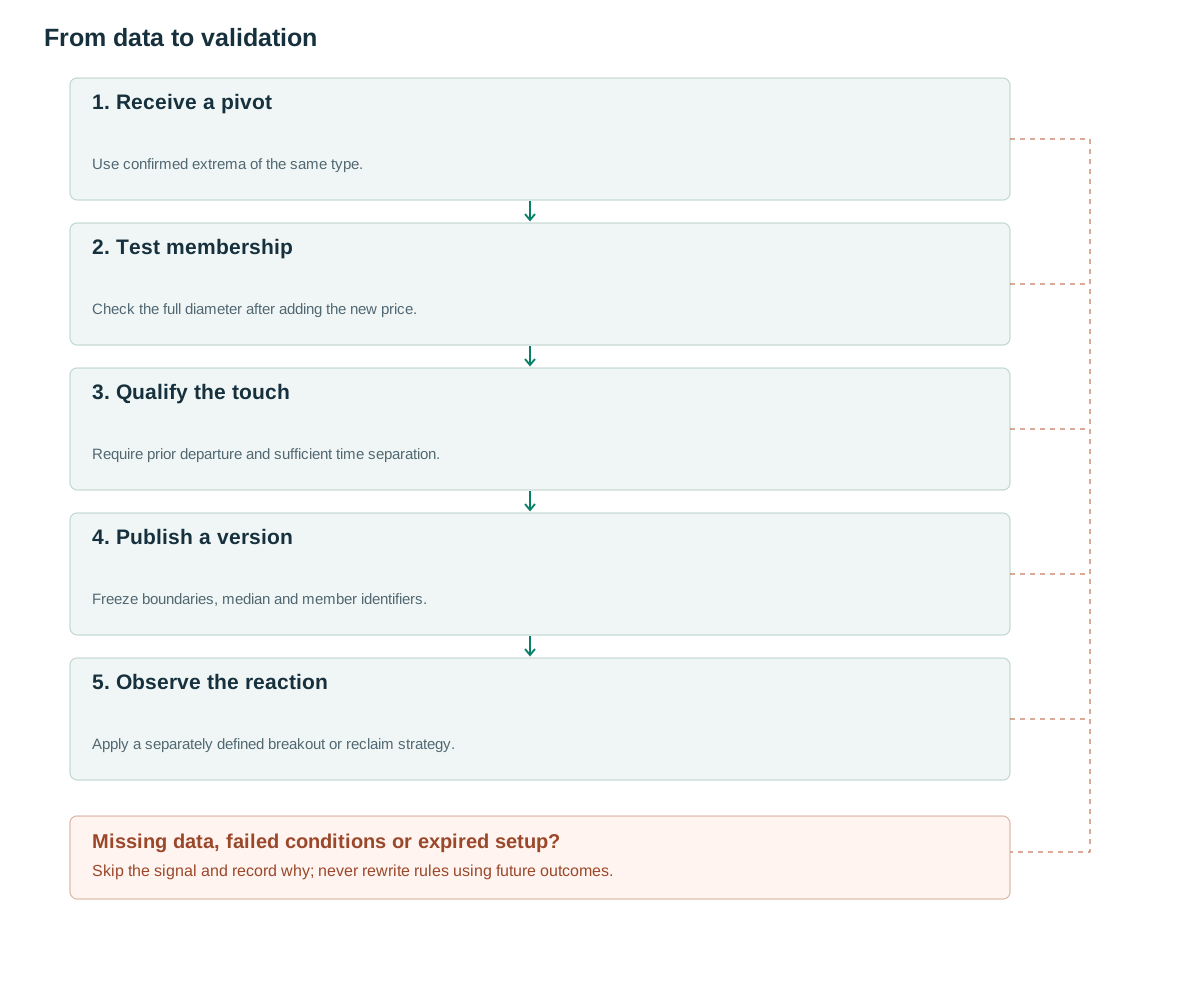
- Receive a pivotUse confirmed extrema of the same type.
- Test membershipCheck the full diameter after adding the new price.
- Qualify the touchRequire prior departure and sufficient time separation.
- Publish a versionFreeze boundaries, median and member identifiers.
- Observe the reactionApply a separately defined breakout or reclaim strategy.
A zone represents observations already known
CME includes prior highs and lows among reference points for support and resistance [1]. In software, a more precise label is a set of confirmed historical extremes lying near one another. That observation does not prove buyers or sellers are currently waiting there, or that the next visit will produce a bounce.
The proposed cluster record contains cluster_id, HIGH or LOW type, member pivot IDs, minimum, maximum, median, latest confirmation time and an independent-touch count. Every member must have been confirmed before the zone is used. An equal-high zone describes price geometry; calling it an order-book wall requires actual order-book evidence.
Separate the detector from the strategy consuming it. The same region can support a fade hypothesis, a continuation breakout or a later role-reversal retest. A zone becoming invalid for one hypothesis does not erase the historical observations used to construct it.
Bound the entire cluster rather than linking a chain
Set epsilon=max(2 ticks,0.15×A_ref), with A_ref frozen when a cluster is created. These are proposed parameters. Add a new pivot only if the resulting maximum minus minimum stays within 2epsilon. This diameter constraint resembles the maximum-distance idea behind complete linkage [2], but the sequential algorithm here is not a complete implementation of AgglomerativeClustering.
If several clusters qualify, choose the nearest median and break ties by oldest cluster ID. Otherwise create a new cluster. W=200 bars and min_separation=5 are research starting points. Keep HIGH and LOW clusters separate until a specific role-reversal protocol has been defined.
Initialize a new cluster with one independent touch. For later members, update geometric membership while incrementing touch count only if both the time-separation and departure conditions hold. A failure to distinguish member count from touch count lets a sideways plateau manufacture apparent evidence.
When an active cluster expires, freeze its final history rather than recycling its ID. A new cluster at the same price is a new object. Store epsilon and its reference ATR with the cluster so a later volatility change cannot silently expand an old zone to absorb inconvenient new pivots.
on_confirmed_pivot(p):
    candidates = active_clusters_of_same_kind(p)
    eligible = [c for c in candidates
      if max(c.max,p.price)-min(c.min,p.price) <= 2*c.eps]
    c = nearest_median_then_oldest_id(eligible)
    if c is None:
        c = new_cluster_with_single_member(p, touch_count=1,
                                          last_touch_index=p.index)
        return
    independent = p.index-c.last_touch_index >= min_separation
    independent &= price_departed_frozen_zone_between(c.last_touch_index,p.index,c)
    add_pivot_once(c,p)
    if independent:
        c.touch_count += 1
        c.last_touch_index = p.index
    if c.touch_count >= 2:
        publish_new_zone_version(c, available_at=p.confirmed_at)
# Active candidates retain their original zone-version snapshot.
Numerical zone construction and a losing reclaim
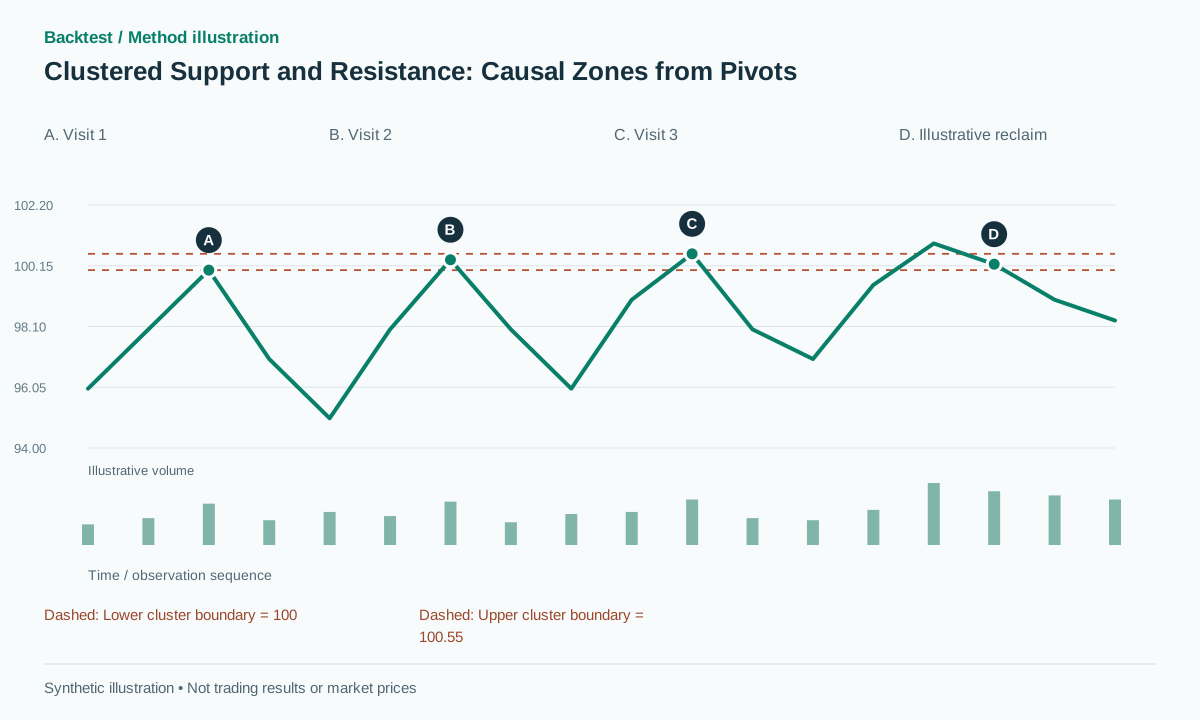
Synthetic example: reference ATR=2 and tick=0.01 give epsilon=0.30 and a maximum diameter of 0.60. Independent confirmed highs at 100.00, 100.35 and 100.55 produce [100.00,100.55] with median 100.35. A new high of 100.80 is rejected because the full width would become 0.80, even though it is only 0.25 from its nearest existing member.
This explains why nearest-member distance is insufficient. A chain 100,100.4,100.8,101.2 can be connected by small adjacent gaps while spanning a broad region. If any later reaction anywhere in that region is called a successful retest, the detector loses a useful falsification criterion.
Illustrative winning path: price extends above 100.55 to 100.90 and closes back at 100.20, creating a proposed short-reclaim candidate. Entry at 100.10, stop 101.00 and target 98.30 imply a gross 2R target. In a failure path, price instead closes at 101.10 and holds above the zone. An already-filled short must retain its loss under the stop policy; the zone cannot be moved upward afterward to rescue the label.
Test a new pivot exactly on the diameter limit and one tick beyond it. Also create a point equidistant from two eligible medians. The same data must always select the same cluster, independently of dictionary iteration order or which chart was loaded first.
Count independent visits rather than consecutive bars
Five adjacent bars near 100.3 usually represent one visit, not five independent tests. The proposed reset requires a close to leave the zone by at least one frozen ATR and at least five bars to elapse before a later touch can count. This explicitly defines a return from outside the region.
The departure event needs its own timestamp. A later confirmed pivot may have occurred before the departure became available; process these events in a declared order and avoid assigning future departures to earlier touches. If pivot confirmation is delayed, store both pivot occurrence and confirmation so the touch qualification can be reconstructed.
Age, independent returns and departure magnitude can become zone features, but future touches must not raise a historical score. Whether repeated testing strengthens a zone or makes it more likely to break is an empirical question. A touch count is not a calibrated probability, and adding ten percentage points per touch would require evidence beyond the detector.
Breakouts and reactions need distinct strategy rules
A proposed reclaim baseline waits for a close back inside the frozen zone and enters at a subsequent executable event. A proposed breakout baseline requires a close beyond max+buffer and may define a separate retest waiting period. Each needs its own invalidation, stop, target and expiry; the zone detector does not choose them.
Osler's official abstract reports evidence that stop-loss orders can contribute to accelerating currency moves [3]. That mechanism does not establish the quantity of stops around an OHLCV high cluster or guarantee that a sweep will reverse. Describe the observable event as an excursion, close breakout or reclaim unless stronger data support a different label.
Store the exact zone version consumed by an order. A new member may publish a wider or shifted version for future candidates, while the existing trade keeps its original rationale. If a strategy allows stop or context updates, record them as explicit actions with activation times instead of redrawing the original setup.
Candle volume is not volume traded at the zone
OHLCV provides a bar's total volume, not the fraction transacted within the zone. Summing all volume from bars that touch the region and calling it volume-at-price is inaccurate, especially for wide-range bars. Trade-level data or a disclosed approximation is required to estimate a price distribution.
Proposed features include breakout-bar RVOL, pullback volume relative to a comparable baseline and mean activity per independent visit. Keep volume outside the geometry so an ablation can remove it without changing cluster membership. Elevated activity may signal a different environment while also worsening the obtainable fill.
Normalize intraday activity by comparable session times and distinguish missing data from real low volume. When visits have different durations, compare rates or equal-duration windows rather than only totals. Report whether volume adds net information after conditioning on range and volatility.
Test zone history and its actual opportunity set
Streaming replay and batch processing should publish identical zone versions. Fixtures need chain-linking attempts, equal-distance ties, W expiry, multiple bars within one visit and delayed pivot confirmations. Every historical trade should reference a stored version_id; today's chart alone is insufficient to reconstruct an old decision.
Compare a single-pivot strategy with otherwise identical two-touch and three-touch variants. Report zone count, waiting time, revisit probability, overlap, exposure and net returns. Zones never revisited remain part of the research opportunity set; keeping only those that generated winning trades biases the result.
Overlap needs a portfolio rule. Several nearby zones can trigger orders on the same market event, producing concentrated exposure that looks diversified by signal ID. Merge candidates under a registered policy or cap simultaneous exposure, then retain the original detector observations for analysis.
Common pitfalls
A chain grows into an unbounded zone
Nearest-pair distance does not constrain the cluster's total span.
Sideways bars inflate the touch count
Without a departure requirement, one prolonged visit looks like repeated independent evidence.
Inferring hidden orders from geometry
A cluster of extrema is not a directly measured map of stops or resting liquidity.
Checklist before using this method
Check each item after verifying it on your data. Progress is saved in this browser; it does not certify a profitable strategy.
Frequently asked questions
Should the zone center be the mean or median?
The median is less sensitive to an outlying member, but triggers should usually reference explicit boundaries. Compare center definitions if the center actually affects the strategy.
Can old support and new resistance be merged?
A role-reversal protocol can be defined after a confirmed break and retest. Preserve state history rather than automatically merging every nearby price.
Research sources
Each source supports the definition or evidence described beside it. The pseudocode, synthetic examples and proposed parameters require separate validation.
- Support and ResistanceCME Group. Read the educational discussion of earlier extremes and price regions. Checked: .
- AgglomerativeClusteringscikit-learn. Read definitions of complete and single linkage. Checked: .
- Stop-Loss Orders and Price Cascades in Currency MarketsCarol L. Osler, Federal Reserve Bank of New York. Read the official abstract only; it is not a backtest of this zone detector. Checked: .
Related methods
Risk note
This content supports education and research design, not financial advice. Backtest is historical simulation, does not guarantee future performance and does not place real trades. Methods in this library are not automatically features available in the app. See methodology and learning center.
Validate rules before risking real capital
Check app support, data and individual simulated trades; advanced detectors may require a separate implementation.
Download Backtest on the App Store