Article contents
- Evidence and scope
- Illustration
- Process
- What the profit claim establishes
- Define the band and the preceding regime
- Compare CVD at the price pivots
- A successful path and two failure cases
- Freeze the target and execute after confirmation
- Test each component and its delay
- Common pitfalls
- Practical checklist
- Frequently asked questions
- Research sources
Evidence and scope
The original community post reports profits but leaves part of its rules private. No independent verification was available. The public specification below is a separate research hypothesis, not a reproduction of that track record.
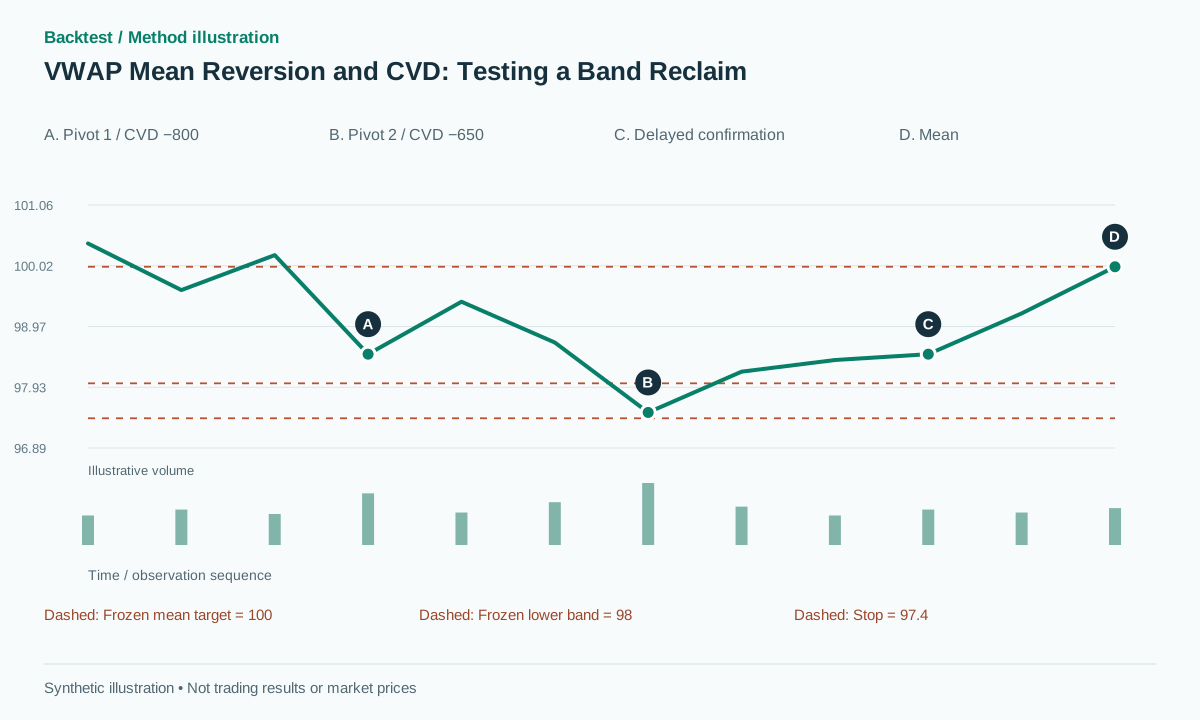 Open full-size illustration
Practical workflow
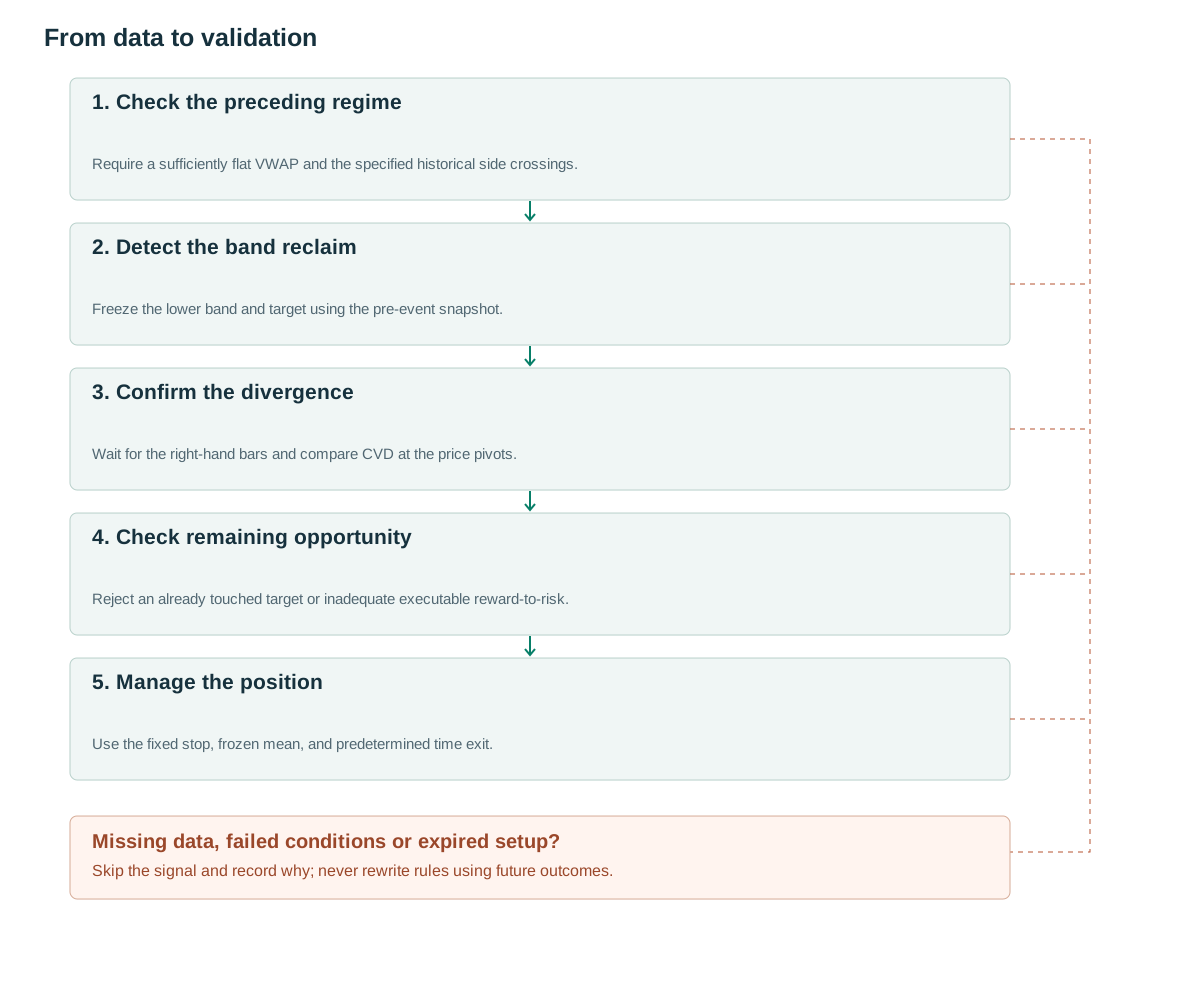
- Check the preceding regimeRequire a sufficiently flat VWAP and the specified historical side crossings.
- Detect the band reclaimFreeze the lower band and target using the pre-event snapshot.
- Confirm the divergenceWait for the right-hand bars and compare CVD at the price pivots.
- Check remaining opportunityReject an already touched target or inadequate executable reward-to-risk.
- Manage the positionUse the fixed stop, frozen mean, and predetermined time exit.
What the profit claim establishes
Rogue-seeker reports year-to-date after-tax profit of $103,750 and a profit factor of 2.15, using VWAP bands, CVD, and custom blocks [1]. The material reviewed does not supply an audited sequence of trades, and some thresholds remain private. Treat it as an origin for an idea. Neither a readable chart nor a confident explanation establishes that another implementation will earn comparable returns.
The difficult assumption is the claim that a move beyond two standard deviations must soon reverse. Intraday observations are dependent over time, and the price-generating process can change during the session. A two-sigma band is not a promise of a 95% probability of returning to VWAP, let alone reaching the target before the stop.
This article separates three decisions: whether the preceding market resembles a range, whether a band excursion has been reclaimed, and whether CVD divergence is confirmed. Undefined volume-profile nodes or private blocks are excluded. Adding them requires another specification with its own data availability and decision timestamps.
Define the band and the preceding regime
Use executed trade quantity as the weight: μ=Σqp/Σq and σ²=Σq(p−μ)²/Σq, accumulated from the session anchor. Implement numerically stable online updates. This is the article's chosen estimator; it need not match every platform. TradingView exposes anchor, source, and band settings [2], so compare implementations before comparing signals.
A proposed range gate requires 20 prior bars, |VWAP[t−1]−VWAP[t−6]|≤0.2A, and at least three changes in the side on which price closes relative to VWAP over the preceding 20 bars. A is ATR14[t−1]. A close exactly equal to VWAP inherits the previous side and does not create a crossing. All these thresholds are research choices.
An event at t requires L[t]<μ[t−1]−2σ[t−1] and C[t] above that same lower band. Freeze target_ref=μ[t−1]. Its low must subsequently qualify as a pivot with two bars on each side. Relative to the previous confirmed price pivot in the same reset period, price must be lower by at least b=max(2 ticks,0.1A), while CVD is higher. After confirmation, require a close above the previous bar's high, below target_ref, and within five bars of the event. Cancel if any intervening bar has already touched the target.
Keep at most one active event. Reject an event without the two required left bars, an event low invalidated before pivot confirmation, a missing CVD segment, or a reset mismatch. Check flow completeness from the earlier price pivot through the event pivot, not only the endpoint values. Consume the event when it signals even if the next quote fails the reward/risk test; a later attractive quote cannot revive that event_id.
at_event_close(t):
  if active_event or not complete_prior_band_ATR_regime_history: return
  if prior_range_regime and L[t]<lower[t-1] and C[t]>lower[t-1]:
    create_event(target=VWAP[t-1],event_low=L[t],A=ATR[t-1],
                 buffer=max(2*tick,0.10*ATR[t-1]),start=t,expiry=t+5,
                 session_id=session_id(t),anchor_id=anchor_id(t),
                 cutoff=session_end-5_minutes,state=AWAITING)
on_completed_bar(now):
  if event.state!=AWAITING: return
  if changed_session_or_anchor(event,now) or received_close_time(now)>=event.cutoff:
    event.state=EXPIRED; return
  if now>event.expiry or target_touched_after_event_through(now):
    event.state=CANCELED; return
  if event_low_no_longer_a_valid_pivot_candidate:
    event.state=CANCELED; return
  if not pivot_confirmed_left2_right2 or not previous_confirmed_pivot: return
  if not same_reset_and_complete_classified_CVD_segment_between_pivots:
    event.state=REJECTED; return
  if price_lower_low_by_frozen_buffer and cvd_higher_low
       and C[now]>H[now-1] and C[now]<event.target:
    stop=min_low_since_event-event.buffer
    event.state=CONSUMED
    check_expected_RR_then_order_on_next_quote_before_cutoff()
# A consumed event permits at most one submission; rejected quotes do not rearm it.
# Session-close and anchor-reset timers terminate pending events without another bar.
Compare CVD at the price pivots
CVD accumulates aggressive buying volume minus aggressive selling volume. Sierra Chart documents an AskVolume−BidVolume implementation and its historical data requirements [3]. Other feeds can classify trades differently. Persist the classification method, instrument, contract, and reset convention; an identical indicator name does not imply identical measurements.
Read CVD at the timestamps of the two price pivots. Do not independently choose attractive lows in CVD and attach them to unrelated price lows. A pivot on one side of a cumulative reset cannot be compared directly with a pivot on the other side. A higher CVD reading at a lower price low is an observation, not identification of a particular institution absorbing supply.
The regime filter sees only the past. Labeling a day as a range because its eventual close returns to the open would introduce future information. A session can also transition from a range into a sustained trend after entry. Predetermine a maximum number of attempts, a cooldown, and a session risk budget so repeated mean-reversion signals do not create uncontrolled aggregate exposure.
A successful path and two failure cases
Consider synthetic normalized data. Before the event, μ=100 and σ=1, giving a lower band of 98. ATR is 1, tick size is 0.01, and b=0.1. The earlier price pivot is 98.5 with CVD −800. The new event reaches 97.5 and closes at 98.2, with CVD −650 at the price low. The next two bars leave that low intact. At confirmation, price closes at 98.5 above the preceding high of 98.4, and 100 has not yet traded.
An available ask of 98.55 and a stop at 97.4 imply risk of 1.15. The frozen target at 100 offers 1.45, or approximately 1.26R before costs. A proposed minimum expected ratio of 1.2 permits this trade. An ask of 98.8 gives risk of 1.4 and reward of 1.2, so the opportunity fails that gate. A nearby mean does not automatically support a two-R target.
On a losing path, renewed selling reaches 97.3 and the stop fills at 97.35, losing 1.20 from the actual entry. In a separate no-trade case, price touches 100 at t+1 and then returns to 98.5 by confirmation. Cancel that event: a delayed entry cannot also collect the earlier rebound that occurred before it became actionable.
Freeze the target and execute after confirmation
The baseline holds the target at the pre-event mean, places the stop below the lowest price from the event through the signal, and exits after ten bars from the fill or before the session ends. A target following live VWAP is another strategy. When both price and VWAP fall, moving the target downward can raise target-hit frequency while reducing the reward per trade.
A purchase pays the available ask and an exit receives an executable bid, subject to the actual order type and liquidity. Convert futures price distance into money with the contract multiplier and round orders to valid ticks. A cost of 0.1 point against a 0.5-point stop already consumes 0.2R before other fees. Tight stops make results based on midpoint fills especially vulnerable to optimism.
The upper-band short version is geometrically symmetric, but report its results separately. Do not increase position size each time price moves farther outside two sigma. Test missing trades, cumulative resets, zero-volume intervals, and a session ending during the confirmation delay. Invalid data should produce an explicit rejection, not a silently interpolated profitable signal.
The baseline sets its entry cutoff five minutes before the scheduled session close, including shortened sessions. Each candidate retains its session_id and, where VWAP is used, its anchor_id. Reaching the cutoff, changing session, or resetting the anchor terminates the pending event. The post-signal quote must also arrive before the cutoff. A session timer cancels waiting states even if no further bar arrives; their bar counters cannot continue the next morning. This cutoff is an article-defined research choice.
Test each component and its delay
Start with every price-only band reclaim, then compare the regime gate, CVD gate, and their combination. Retain rejected events in the dataset. Match comparisons by time of day and prior volatility; otherwise the combined rule may simply select quiet midday conditions without identifying useful divergence.
Group overlapping events during validation and separate development periods from untouched years or market conditions. Report net expectancy, turnover, drawdown, and consecutive stops. Also count cases that return to the mean before pivot confirmation. That statistic measures the opportunity cost of waiting and helps distinguish a convincing retrospective chart from a tradable sequence.
Forward paper trading should retain both exchange event time and local receive time. A decision uses information received before that decision. Only a frozen specification that survives out-of-sample costs and plausible fills can support a stronger evidence claim. The community author's reported performance cannot substitute for those tests.
Common pitfalls
A range label from the eventual close
Using the completed day to classify its earlier regime lets the filter see the future.
A silently moving target
A dynamic VWAP target and a frozen pre-event mean are different strategies and require separate results.
Claiming to reproduce private rules
Missing custom blocks or undisclosed thresholds prevent reproduction of the source author’s reported performance.
Checklist before using this method
Check each item after verifying it on your data. Progress is saved in this browser; it does not certify a profitable strategy.
Frequently asked questions
Does a move beyond two sigma prove that price is oversold?
No. It describes distance under a particular estimator. A developing trend can keep shifting the distribution and extend the excursion.
Can OBV replace CVD when trade classification is unavailable?
OBV measures a different feature and cannot reconstruct aggressive trade delta. Test price-only or OBV variants under distinct names and specifications.
Research sources
Each source supports the definition or evidence described beside it. The pseudocode, synthetic examples and proposed parameters require separate validation.
- Here's how being a dev helped me make YTD $104k (NET profit)Rogue-seeker on r/Daytrading. The post and discussion were reviewed. Results are self-reported, some rules are private, and profit was not independently verified. Checked: .
- Volume Weighted Average PriceTradingView. Documents VWAP and band configuration. The weighted variance formula in this article is explicitly its own specification. Checked: .
- Cumulative Delta Bars – VolumeSierra Chart. Defines Ask/Bid volume, historical data requirements, and reset behavior. Platform accuracy marketing is not treated as independent evidence. Checked: .
Related methods
Risk note
This content supports education and research design, not financial advice. Backtest is historical simulation, does not guarantee future performance and does not place real trades. Methods in this library are not automatically features available in the app. See methodology and learning center.
Validate rules before risking real capital
Check app support, data and individual simulated trades; advanced detectors may require a separate implementation.
Download Backtest on the App Store