Article contents
Evidence and scope
The cited material supports terminology and research context. The numerical thresholds, state machine, execution policy and synthetic examples below are proposed by this research project. No new backtest has been run, and the references do not establish profitability for this configuration.
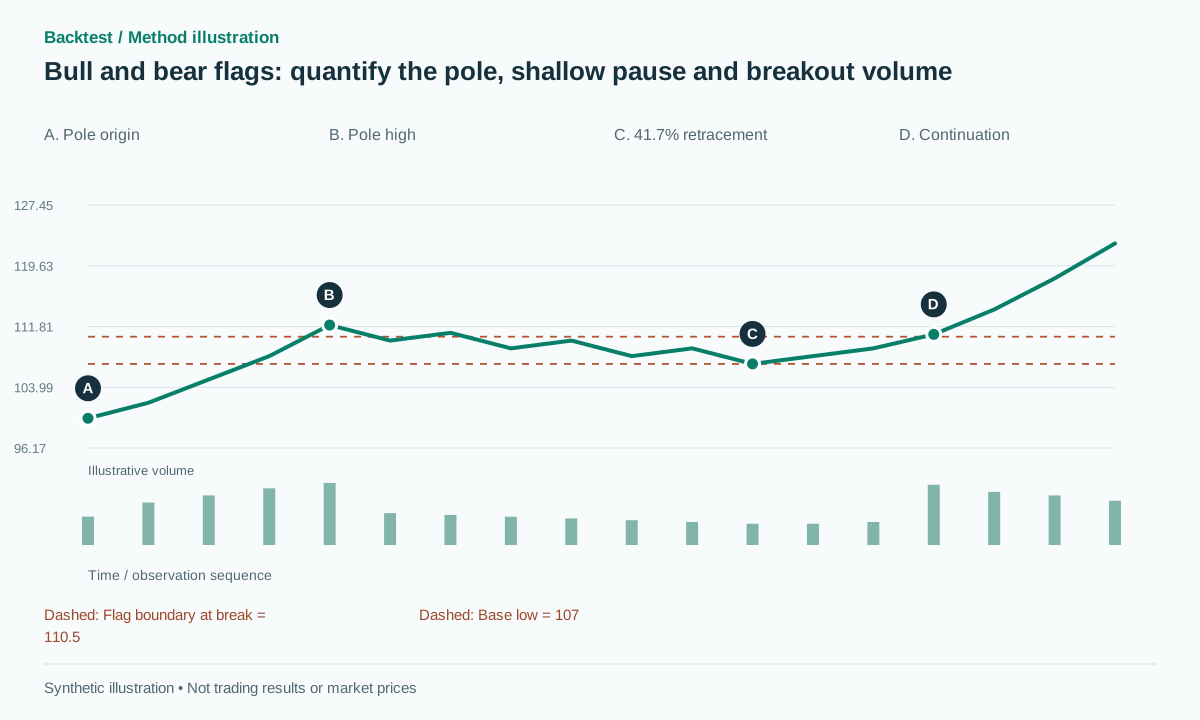 Open full-size illustration
Practical workflow
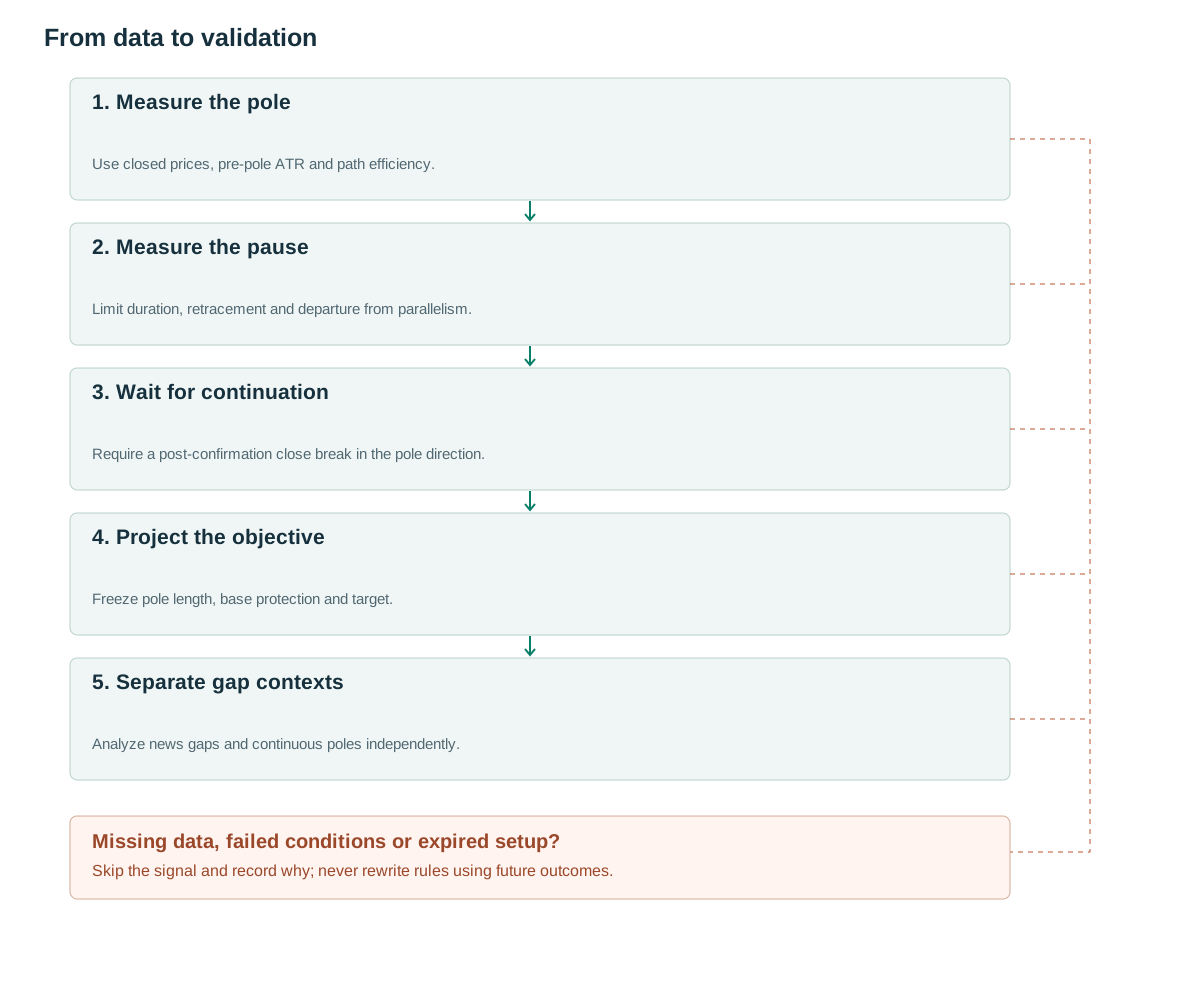
- Measure the poleUse closed prices, pre-pole ATR and path efficiency.
- Measure the pauseLimit duration, retracement and departure from parallelism.
- Wait for continuationRequire a post-confirmation close break in the pole direction.
- Project the objectiveFreeze pole length, base protection and target.
- Separate gap contextsAnalyze news gaps and continuous poles independently.
What the structure tells us
A flag combines a strong move, called the pole, with a pause used to study continuation. [1] Bull and bear labels refer to the pole direction. The consolidation commonly slopes against that direction or remains approximately horizontal.
The hypothesis is that an efficient move is followed by limited retracement and renewed momentum. A large up bar alone is insufficient: news, opening gaps and thin liquidity can produce similar shapes with different execution risks. Store the pole, consolidation and breakout as separate components rather than one visual label.
This separation also supplies useful controls. If requiring a parallel pause adds nothing beyond selecting strong momentum, the simpler momentum rule may explain the result. Conversely, a favorable consolidation may matter only when it follows a particular type of pole. These are empirical questions, not assumptions built into the name.
Rules using information already available
Proposed pole settings: length 3–20 bars and magnitude P=|C[end]−C[start]|≥3A, where A is ATR(14) available before the pole begins. Define path efficiency ER=P/sum(|C[i]−C[i−1]|) and require ER≥0.7. Use enough earlier history to calculate A. Substituting ATR after the strong move would change the reference and potentially change which poles qualify.
The consolidation lasts 5–30 bars and uses pivots confirmed with either two or three right-hand bars; choose one delay before research. Fit approximately parallel boundaries, requiring slope difference times duration to be no more than 0.2 of consolidation width. A bull flag must be horizontal or downward sloping, with retracement from pole high to base low no greater than 0.5P. The bear version mirrors these rules.
Freeze the pole, base lines and ATR reference when the candidate is formed. A bull trigger is a close crossing above U(t)+b, where b=max(2 ticks,0.1A). Expire after 30 bars from the start of the base or invalidate when retracement exceeds half the pole. Pivot confirmation is delayed. [2] Do not scan the future to choose whichever pole origin produces the best target.
The candidate must exist before the triggering close. If a short flag completes and breaks while the last required pivot is still awaiting confirmation, this delayed version misses the move. That loss of coverage is part of the detector’s behavior and should appear in the report.
detect pole using closed prices and pre-pole ATR
if pole.P>=3*A and pole.ER>=0.7:
  track 5..30-bar consolidation
  when parallel_flag_is_confirmed: freeze boundaries
  base_bar_count=t-base_start+1
  if base_bar_count>30: expire
  elif retracement>0.5*P: cancel
  elif t>created and bullish and C[t-1]<=U(t-1)+b and C[t]>U(t)+b:
    emit LONG; stop=flag_low-epsilon; target=U(t)+P
# Bear flags reverse comparisons; target=B(t)-P.
# epsilon=max(2 ticks,0.15A).
Giving volume a specific job
Two straightforward features are median base volume divided by median pole volume, and RVOL at breakout. Trial settings might require a base-to-pole ratio below 0.7 and breakout RVOL≥1.5. These are proposed research choices, not numerical rules attributed to the source. Use per-bar activity rather than total volume when pole and base durations differ.
If the pole contains an opening gap, part of the displacement did not occur through continuous trading. Tag gap poles separately, especially around company announcements. A high-volume breakout does not repair an entry that is too far from the boundary or a stop that is economically too distant.
Keep contraction and expansion measurements separate when testing. A low-activity pause and an active break may each contribute differently. Intraday comparisons also need a seasonality adjustment so a pole at the open followed by a midday pause is not automatically classified as unusual volume contraction.
Numerical examples and failure cases
Synthetic example: price rises from 100 to 112 over eight bars. A=2, so P=12 exceeds 3A=6. Total absolute close-to-close movement is 15, giving ER=0.8. A ten-bar base retraces to 107, or 5/12=41.7% of the pole. At a breakout-boundary value of 110.5, a close of 110.8 lies above that boundary by more than the buffer b=0.2. An entry at 111, stop at 106.7 and target at 122.5 imply risk of 4.3 and reward of 11.5, about 2.67R before costs.
Invalidation example: the base falls to 105.5, a retracement of 6.5 that exceeds 0.5P. Cancel before entry. In a different path, the valid breakout fills at 111 and subsequently reaches 106.7; record the stopped trade. Do not select a lower pole origin afterward to make a deep retracement look compliant.
For a successful synthetic path, price reaches 122.5 before protection or another declared exit. The example shows how the pole projection is calculated, not how often it succeeds. Report the difference between projected reward at entry and realized reward, particularly if partial exits or trailing rules are later introduced.
Entry, invalidation and exits
The baseline stop lies outside the consolidation extreme. Project the pole length from the boundary at breakout. Measuring from the actual entry instead produces a different target and must be specified before testing. Partial exits by R multiple are possible, but each fill and cost needs modeling; the full pole projection cannot be presented as guaranteed realized profit.
Close confirmation sacrifices part of the initial move in exchange for a completed-bar trigger. A resting breakout order may enter earlier but can fill on a temporary intrabar excursion. Do not combine the best fills from these two approaches in one result series. Any pre-submission gap or spread filter must use an available quote, not hindsight after a fill.
When several bars are used to confirm base pivots, ensure the declared flag low includes only observations known at candidate creation. Later protective updates require a causal schedule. A gap through the initial stop can produce a loss greater than planned R, and should remain in the ledger.
Testing incremental value
Use a breakout after any sufficiently large upward move as the control, without requiring a flag. Add path efficiency, shallow retracement, parallelism and volume one at a time. Multiple filters can sharply reduce the sample; coverage is as important to disclose as the average outcome of remaining trades.
Separate news-driven poles, poles with gaps and continuous moves. Test chronologically out of sample with realistic position sizes and execution costs. The reference [3] does not establish that a pole-length projection will be achieved.
Implementation checks should include a strong but inefficient zigzag, an efficient pole below the magnitude threshold, a base lasting 31 bars, and retracement exactly at the permitted limit. A pole-origin test should freeze the start once selected and confirm that later data cannot enlarge P. Compare parallel and converging bases under the same pole to distinguish flags from pennants without double-counting the opportunity.
Common pitfalls
Calling every pullback a flag
A weak pole or an excessively long base belongs to a different hypothesis.
Changing the pole origin
Selecting a new start after the break retrospectively optimizes both magnitude and target.
Comparing total volume across unequal durations
A longer base can have more total activity while each bar is quieter. Normalize the comparison.
Checklist before using this method
Check each item after verifying it on your data. Progress is saved in this browser; it does not certify a profitable strategy.
Frequently asked questions
May a flag be horizontal?
Yes in this configuration. A base sloping strongly in the pole direction should have a different label so acceleration is not mixed with a pause.
Is a bear flag just a flipped bull flag?
The geometry can be mirrored. Short availability, borrowing costs and upside gaps mean economic results need not be symmetrical.
Research sources
Each source supports the definition or evidence described beside it. The pseudocode, synthetic examples and proposed parameters require separate validation.
- IG: Bull flag and bear flag chart patterns explainedIG. Flag and pole terminology; the public explanation was read. Checked: .
- TradingView: RepaintingTradingView. Pivot confirmation delay and repainting. Checked: .
- Lo, Mamaysky, Wang: Foundations of Technical AnalysisNBER / Columbia University. Background on systematic pattern research; this configuration is not tested by the paper. Checked: .
Related methods
Risk note
This content supports education and research design, not financial advice. Backtest is historical simulation, does not guarantee future performance and does not place real trades. Methods in this library are not automatically features available in the app. See methodology and learning center.
Validate rules before risking real capital
Check app support, data and individual simulated trades; advanced detectors may require a separate implementation.
Download Backtest on the App Store