Article contents
Evidence and scope
The cited material supports terminology and research context. The numerical thresholds, state machine, execution policy and synthetic examples below are proposed by this research project. No new backtest has been run, and the references do not establish profitability for this configuration.
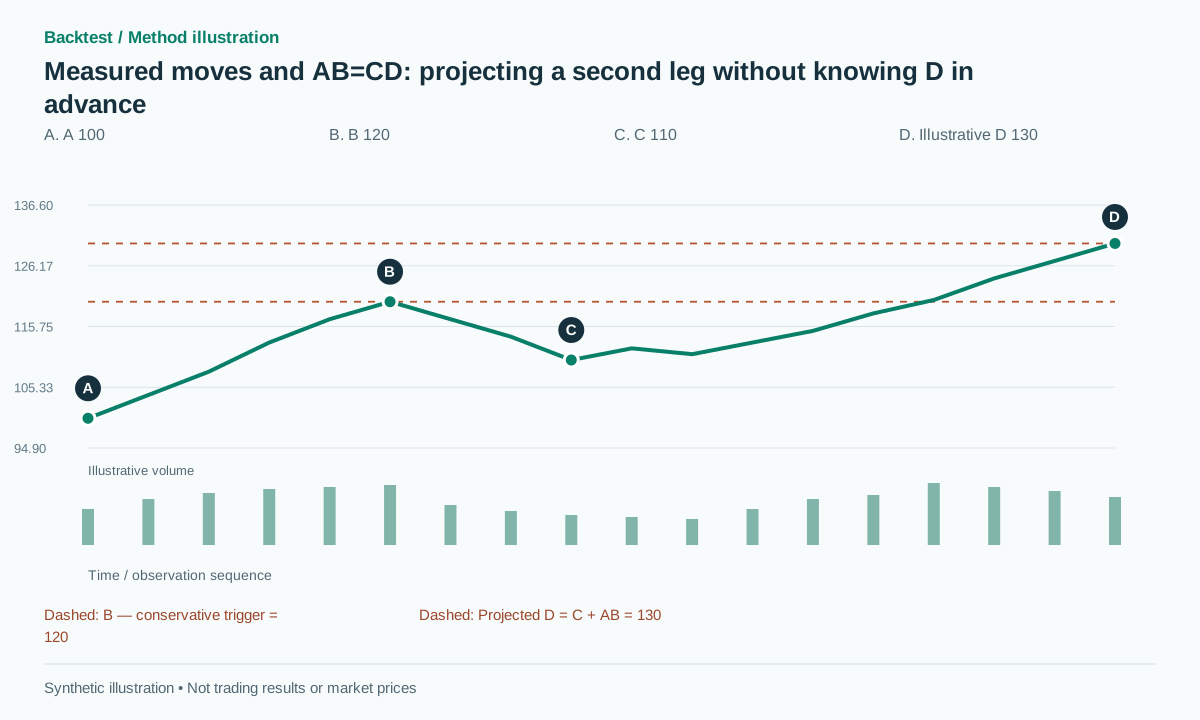 Open full-size illustration
Practical workflow
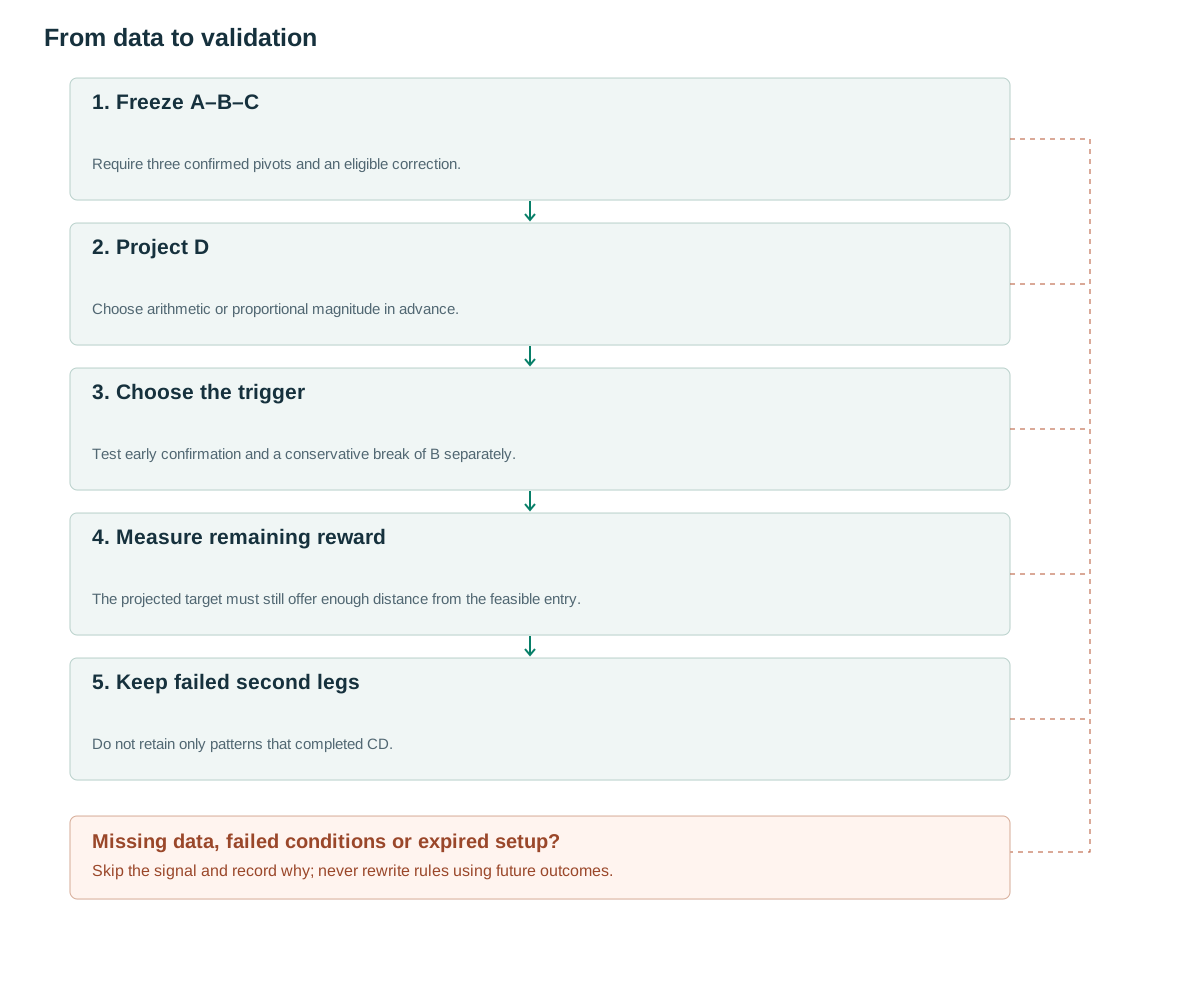
- Freeze A–B–CRequire three confirmed pivots and an eligible correction.
- Project DChoose arithmetic or proportional magnitude in advance.
- Choose the triggerTest early confirmation and a conservative break of B separately.
- Measure remaining rewardThe projected target must still offer enough distance from the feasible entry.
- Keep failed second legsDo not retain only patterns that completed CD.
What the structure tells us
ChartSchool describes the bullish measured move as an advance, a correction and a continuation, with projections expressed in price points or percentages. [1] Here AB=CD is shorthand for comparable leg magnitude, not a claim to implement every harmonic AB=CD rule or specialized Fibonacci relationship.
The structure supplies a falsifiable target hypothesis but does not automatically create an entry. A strong first leg can be followed by a deep reversal rather than a comparable second leg. A trading specification therefore needs a trigger after C, an invalidation level and a waiting limit.
Keep recognition separate from projection. The candidate becomes available once A, B and C are confirmed and its conditions pass. The target can then be stored whether price eventually reaches it or not. A dataset containing only completed AB=CD shapes removes precisely the failed second legs that matter to a prospective strategy.
Rules using information already available
Proposed bullish settings: use three confirmed pivots A low, B high, C low in that order, with three bars on each side for confirmation. Let P=B−A≥3ATR0, where ATR0 is ATR(14) available before the AB leg begins. Require C>A and correction ratio q=(B−C)/P between 0.33 and 0.67. Choose any additional BC-duration restriction before testing.
The arithmetic target is D1=C+P. The proportional target is D2=C×(B/A), applicable only when A and C are positive and the price scale makes the ratio meaningful. Do not switch to the lower target after observing that price fell short. CD completion is not required to create the candidate.
Separate two possible triggers: a conservative close above B+b, and an earlier break of a small confirmed base after C. This article’s baseline uses the conservative trigger, b=max(2 ticks,0.1ATRc), where ATRc is measured when C becomes confirmed. Set protection at C−epsilon, with epsilon=max(2 ticks,0.15ATRc). Pivots are available with a delay. [2]
The target is frozen before entry. If confirmation takes so long that the available price has already reached or exceeded the projection, the setup has no remaining projected reward. A rule may reject it before order submission; moving D farther away would be a different target policy and cannot rescue the original calculation.
on C confirmation:
  if A<B and A<C<B and P>=3*ATR0 and 0.33<=q<=0.67:
    freeze A,B,C,target=C+P,created,ATRc
for later closed t before expiry:
  if Low[t]<C-epsilon: cancel
  elif C_close[t-1]<=B+b and C_close[t]>B+b:
    emit LONG at next executable event
    stop=C-epsilon; target remains C+P
# expiry=created+max(5,ceil(duration_AB)); C_close means bar close.
# Bearish mirror: A high, B low, C high.
Giving volume a specific job
One hypothesis is lower activity during BC than during AB, followed by expansion at the trigger. Compare median volume per bar rather than totals. Freeze the BC window when C becomes confirmed; do not extend it into CD with favorable later bars to improve the ratio.
Test trigger RVOL≥1.5 against the unfiltered version. If conservative confirmation routinely enters after much of the projected move has already occurred, strong volume does not restore the lost reward. Analyze entry timing and remaining reward-to-risk together.
Volume conditions should also be distinguished from pole or trend conditions. A large AB leg can generate high activity merely because it spans a news event. Tag that context and test its contribution rather than attributing every difference between AB and BC to declining supply.
Numerical examples and failure cases
Synthetic example: A=100, B=120, C=110, ATR0=2 and ATRc=2. P=20 and the correction is 50%. The arithmetic target is 130 and the proportional target is 132. If entry waits for a close above B with b=0.2, a feasible fill at 120.4 and stop at 109.7 imply risk of 10.7. Only 9.6 of reward remains to 130, about 0.90R before costs. An attractive measured-move shape can therefore offer poor economics at a conservative entry.
Synthetic early-entry variant: after C, a small base has a confirmed upper boundary at 113. Entering after its break at 113.4 with the same 109.7 protection offers approximately 4.49R to 130. This is a different strategy, not an already-demonstrated improvement. If price returns to 109.6, the early version loses while the conservative version may never have entered.
The examples show why the trigger and target cannot be evaluated independently. A high target multiple from an early entry must be weighed against its additional failed attempts. A later entry may improve directional confirmation but leave insufficient reward. Only a comparison across the full candidate set can resolve that tradeoff.
Entry, invalidation and exits
Freeze target and protection when issuing the signal. If the executable price has passed the projection or violates a minimum reward rule, reject the new order before submission. Do not move D upward just to create a trade. After a fill, retain all actual gap and slippage effects in the execution record.
Partial exits and trailing protection can be investigated, but change the return distribution relative to a fixed projection. The bearish arithmetic version mirrors the price differences. Percentage projections are unsuitable near zero or for prices that can become negative; disable them through a declared data policy rather than handle difficult examples opportunistically.
Define a time-based exit or holding policy before a full backtest, even when the detector already has a candidate expiry. Expiry controls how long entry may be sought; it does not automatically determine how an open trade is managed. The choice should remain the same across target comparisons so that only the projected objective changes.
Testing incremental value
Compare measured targets with 2R and trailing exits on the same entries to isolate the target’s contribution. Then compare early and conservative triggers using fills, missed opportunities, net expectancy and drawdown, not just their theoretical R multiples.
Test nearby correction ranges around one third to two thirds and different first-leg durations. Adding Fibonacci conditions after optimizing them on the same sample does not provide independent confirmation. The methodological source [3] does not establish profitability for any projection or configuration in this article.
Implementation tests should include a correction that touches A, a correction just outside the permitted ratio, delayed C confirmation, and an entry quote already beyond D. Verify arithmetic and proportional projections with hand-calculated examples. A prospective replay should create the candidate at C confirmation without consulting later CD bars, and preserve candidates whose targets are never reached.
Common pitfalls
Selecting C after D is visible
Keeping only completed shapes removes failed second legs from the dataset.
Equating this shorthand with all harmonic rules
The notation here does not include every ratio or reversal-zone condition of another methodology.
Choosing the target retrospectively
Using the arithmetic projection for near misses and the proportional one for stronger moves manufactures favorable outcomes.
Checklist before using this method
Check each item after verifying it on your data. Progress is saved in this browser; it does not certify a profitable strategy.
Frequently asked questions
Must AB and CD take equal time?
Not in this version, which projects magnitude. Similar duration is a separate hypothesis requiring its own feature and tolerance.
Is a measured move an entry signal by itself?
No. It is a structure and projection. The trigger after C is an additional strategy component that must be defined.
Research sources
Each source supports the definition or evidence described beside it. The pseudocode, synthetic examples and proposed parameters require separate validation.
- StockCharts ChartSchool: Measured Move — BullishStockCharts. Three-stage measured-move structure and arithmetic/proportional projections; the public explanation was read. Checked: .
- TradingView: RepaintingTradingView. Pivot confirmation delay and repainting. Checked: .
- Lo, Mamaysky, Wang: Foundations of Technical AnalysisNBER / Columbia University. Background on systematic pattern research; this configuration is not tested by the paper. Checked: .
Related methods
Risk note
This content supports education and research design, not financial advice. Backtest is historical simulation, does not guarantee future performance and does not place real trades. Methods in this library are not automatically features available in the app. See methodology and learning center.
Validate rules before risking real capital
Check app support, data and individual simulated trades; advanced detectors may require a separate implementation.
Download Backtest on the App Store