Article contents
- Evidence and scope
- Illustration
- Process
- Observable price clustering and the liquidity hypothesis
- Limit the width of the entire cluster
- Volume around touches must respect confirmation time
- Synthetic clusters, chaining failure and trade outcomes
- A zone becomes a trade only through a separate trigger
- Validate reference quality before trading returns
- Common pitfalls
- Practical checklist
- Frequently asked questions
- Research sources
Evidence and scope
An original indicator offers EQH/EQL, while support/resistance research and repainting documentation provide context. The proposed online clustering algorithm has no demonstrated trading profitability here.
 Open full-size illustration
Practical workflow
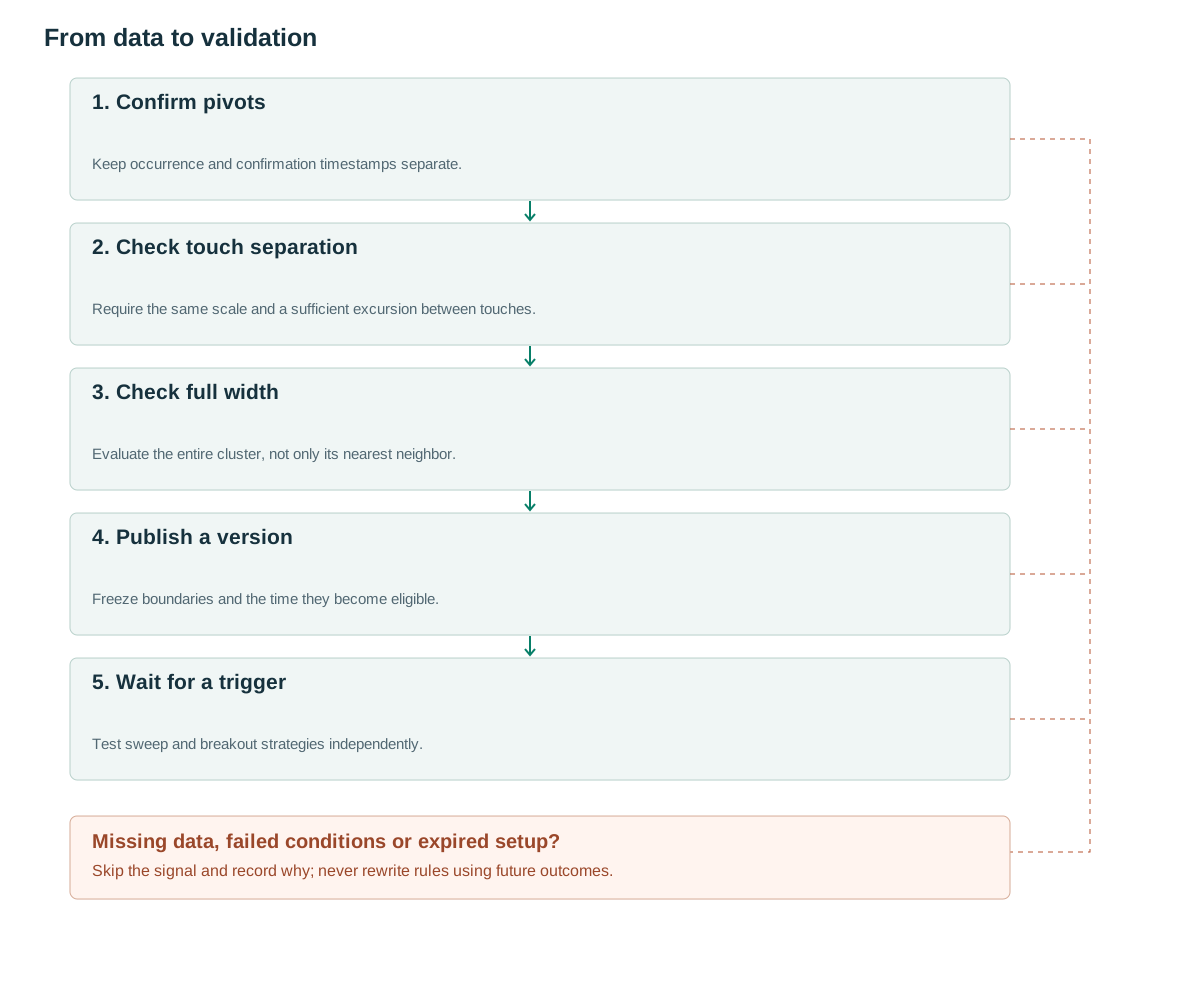
- Confirm pivotsKeep occurrence and confirmation timestamps separate.
- Check touch separationRequire the same scale and a sufficient excursion between touches.
- Check full widthEvaluate the entire cluster, not only its nearest neighbor.
- Publish a versionFreeze boundaries and the time they become eligible.
- Wait for a triggerTest sweep and breakout strategies independently.
Observable price clustering and the liquidity hypothesis
Two lows at 50 and 50.08 may be approximately equal when normal fluctuations are much larger than their difference. On an instrument with a 0.25 tick, however, 50.08 is not a valid unadjusted trade price. The detector must understand the price grid before applying statistical tolerance.
LuxAlgo exposes EQH/EQL with configurable confirmation [1]. Osler’s research concerns support/resistance within its own empirical scope [2]. Neither establishes a universal win rate for two nearby pivots. The purpose here is an online reference-zone generator for subsequent sweep or breakout research.
Two similar highs are not automatically a double top. A reversal pattern also requires prior context, an intervening valley and a neckline trigger. Equal highs describe location alone; they can occur within an uptrend that later breaks higher. Touch counts do not reveal the volume of stop orders beyond the zone.
Limit the width of the entire cluster
Proposed pivots use three left and three right bars. A high at i is known at i+3 and becomes eligible at i+4. When a cluster is created, freeze A_ref from the preceding ATR14 and eps=max(2 ticks,0.15A_ref). Require at least two same-type, same-scale pivots and a full price spread no larger than 2eps. The zone spans the actual minimum and maximum pivot prices; its center is their median. Do not add eps again to both boundaries.
Proposed touches must be at least five bars apart, with price moving at least eps away between them. This prevents a brief sideways patch from becoming several apparently independent tests. A sample TTL is 100 bars from publication. Age remains a feature to measure rather than a rule that older levels must be stronger.
If a new pivot fits multiple clusters, choose the nearest center, breaking ties in favor of the newer cluster. Reject any addition that makes the entire cluster too wide. Neighbor chaining is insufficient: A can be near B and B near C while A and C are too far apart.
The first qualifying pivot can initialize an unpublished seed. Only a second valid, separated pivot publishes a tradable reference. An implementation must define seed expiry and tie behavior as well as the mature-cluster rule; otherwise isolated pivots can persist indefinitely until a convenient match arrives.
To complete the baseline, an unpublished seed expires 100 bars after its first pivot is confirmed. A published cluster expires 100 bars after first publication; later versions do not extend that deadline. Measure departure only between the two touch occurrence times, excluding bars after the second touch during its confirmation delay. Ignore duplicate pivot IDs and honor eligible_from when publishing.
for p in newly_confirmed_pivots:
  eligible_from = p.confirmed_at+1
  expire_seeds_and_clusters_at_fixed_deadlines(p.confirmed_at)
  candidates = active_clusters_same_type_and_scale(p)
  keep = [c for c in candidates if
          max(c.prices+[p.price])-min(c.prices+[p.price]) <= 2*c.eps]
  c = nearest_center_then_newest(keep)
  if c is None:
    A = ATR14[p.confirmed_at-1]
    if not finite_positive(A): continue
    create_unpublished_seed(p,eps=max(2*tick,0.15*A),
                            seed_expiry=p.confirmed_at+100)
    continue
  if p.id in c.pivot_ids: continue
  if not separated_touch_between_occurrences(p,c,min_bars=5): continue
  append_pivot_once(c,p)
  c.last_touch_index = p.occurred_at
  if c.first_published_at is None:
    c.first_published_at = p.confirmed_at
    c.expiry = p.confirmed_at+100
  publish_new_version(c,eligible_from=eligible_from,expiry=c.expiry)
# Departure is measured only between touch occurrence times.
# Later versions never reset expiry or rewrite active setup snapshots.
Volume around touches must respect confirmation time
A symmetric volume window around a pivot includes future bars relative to the pivot location. Its complete feature is unavailable until the right side finishes. If the zone is published earlier, that feature cannot participate in the decision. A simpler alternative measures from the touch through pivot confirmation using the same duration for each touch.
Declining volume at the second touch can be tested as a weakening-pressure hypothesis. Preserve increasing-volume touches that also fail to cross the level. Neither histogram shape identifies accumulation, distribution or a specific participant. A cluster aligned with the prevailing trend may instead support continuation through the zone.
For intraday data, normalize by the same time slot. Comparing an opening low with a lunchtime low using raw volume confounds touch order with normal session activity. Missing prints or a shorter session must not masquerade as evidence of drying supply.
Synthetic clusters, chaining failure and trade outcomes
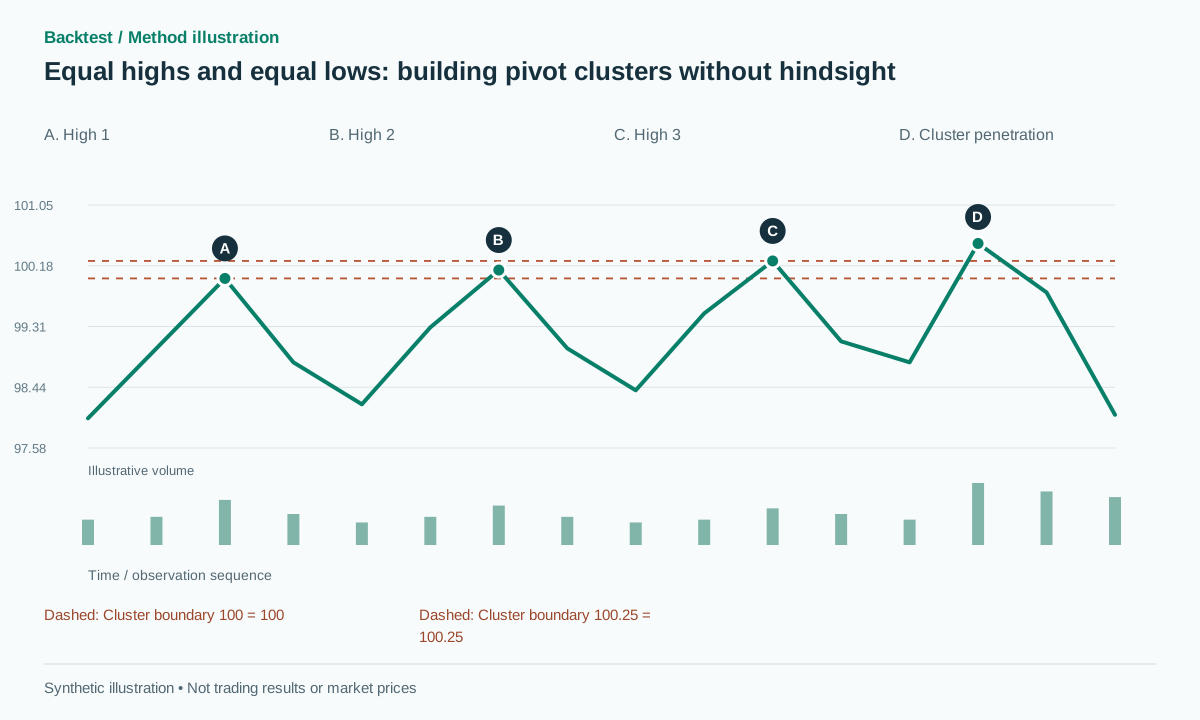
With tick=0.01 and A_ref=1, eps=0.15 and maximum width=0.30. Highs at bars 10, 24 and 39 are 100, 100.12 and 100.25. Once all are confirmed and the separation conditions hold, their zone is [100,100.25], centered at 100.12. The final version becomes usable only after the last high is confirmed, not retrospectively at bar 10.
A new high at 100.42 is only 0.17 from 100.25, but it expands the whole group to 0.42. Reject it from the old cluster. Creating a new cluster is a possible policy; moving the coordinates of an already active setup is not. This example exposes why nearest-neighbor chaining can drift without limit.
For a downstream trade example, a later bar reaches 100.50 and closes at 99.80, potentially satisfying an upside-sweep rule with its own buffers. A synthetic short at 99.75, stop at 100.60 and target at 98.05 offers 2R before costs. If the next move reaches 100.80 and protection fills at 100.65, the loss is 0.90. The valid cluster never promised to hold.
A zone becomes a trade only through a separate trigger
Use the same published clusters to test both fading a sweep/reclaim and following an accepted breakout. Shorting merely because a second high has been confirmed is another strategy entirely. Price might not revisit the area for many bars.
Each candidate retains zone_version until expiry. A later qualifying touch creates a new version with its own eligible_at. A running sweep detector must not expand its boundary after a penetration and thereby erase the event. Store source_pivot_ids so every reference can be reconstructed.
After a close-break, a zone can be consumed or moved into a new state under a predetermined policy. Overlap with a prior-day level is useful metadata, not permission to double the risk budget. TradingView’s timing documentation helps distinguish a marker drawn at a past pivot from the time that pivot became known [3].
For simultaneous cluster versions, use an explicit selection rule, such as the oldest eligible version or the nearest outer boundary. Selecting whichever version produces the narrowest profitable stop after the trade would introduce another hidden optimization.
Validate reference quality before trading returns
First require prefix-replay consistency: processing one bar at a time must produce the same published versions as a batch calculation restricted to that prefix. Test equal-price ties, missing bars, corporate actions and changing ticks. Full-sample clustering followed by historical scoring is not an online detector.
Then measure the first later approach to each zone, retaining both breakouts and rejections. Match controls by zone age, width, touch count and regime. Rolling extrema or random grids with similar density are useful comparisons. If the algorithm draws hundreds of levels, nearly every reversal will appear close to one.
Report coverage, candidates per session and the net results of each specific trigger. Keep the same risk allocation when comparing two-touch and three-touch clusters. More touches can mean stronger recognition, repeated consumption of resting liquidity, or simply a longer-lived zone; the data must distinguish these hypotheses rather than assuming a monotonic improvement.
Common pitfalls
One absolute tolerance everywhere
A fixed currency distance can behave differently across volatility regimes; test ATR and tick sensitivity.
Chaining neighboring pivots
Use full maximum-minus-minimum width to prevent drifting zones.
Treating equal highs as a double top
Without reversal context and a neckline, the cluster is only a reference.
Checklist before using this method
Check each item after verifying it on your data. Progress is saved in this browser; it does not certify a profitable strategy.
Frequently asked questions
Must the prices be exactly equal?
No. Define tolerance using the tick and a predetermined volatility reference, then preserve it throughout the test.
Are three touches always stronger than two?
No universal relationship is assumed here. Additional touches may also accompany weakening support or resistance; evaluate them by regime.
Research sources
Each source supports the definition or evidence described beside it. The pseudocode, synthetic examples and proposed parameters require separate validation.
- Smart Money ConceptsLuxAlgo on TradingView. Read the original tool description and its evidence limitations. Checked: .
- Support for ResistanceFederal Reserve Bank of New York. Read the original research announcement; it does not test this clustering variant. Checked: .
- RepaintingTradingView. Read documentation on historical versus real-time calculations. Checked: .
Related methods
Risk note
This content supports education and research design, not financial advice. Backtest is historical simulation, does not guarantee future performance and does not place real trades. Methods in this library are not automatically features available in the app. See methodology and learning center.
Validate rules before risking real capital
Check app support, data and individual simulated trades; advanced detectors may require a separate implementation.
Download Backtest on the App Store