Article contents
- Evidence and scope
- Illustration
- Process
- An extreme has an occurrence time and a confirmation time
- A deterministic definition with an explicit tie-break
- Numerical examples and cases that must fail
- Turning anchors into a distinct trading hypothesis
- Volume features belong to specific timestamps
- Verify event correctness before evaluating returns
- Common pitfalls
- Practical checklist
- Frequently asked questions
- Research sources
Evidence and scope
The sources support local-extreme terminology and the danger of plotting information backward. Tie-breaking, event handling and the trading experiment below are research proposals. No profitability backtest has been run for this implementation.
 Open full-size illustration
Practical workflow
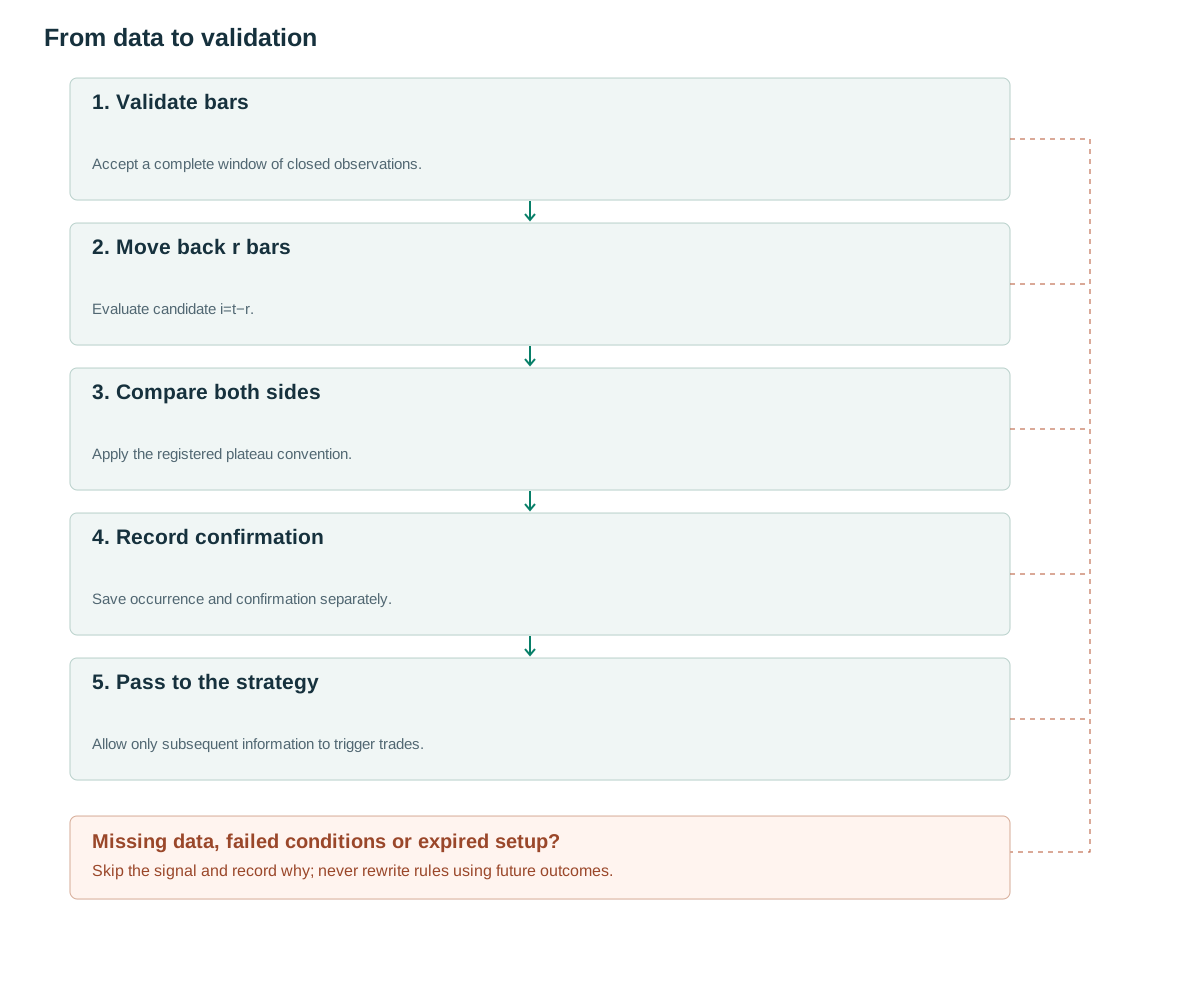
- Validate barsAccept a complete window of closed observations.
- Move back r barsEvaluate candidate i=t−r.
- Compare both sidesApply the registered plateau convention.
- Record confirmationSave occurrence and confirmation separately.
- Pass to the strategyAllow only subsequent information to trigger trades.
An extreme has an occurrence time and a confirmation time
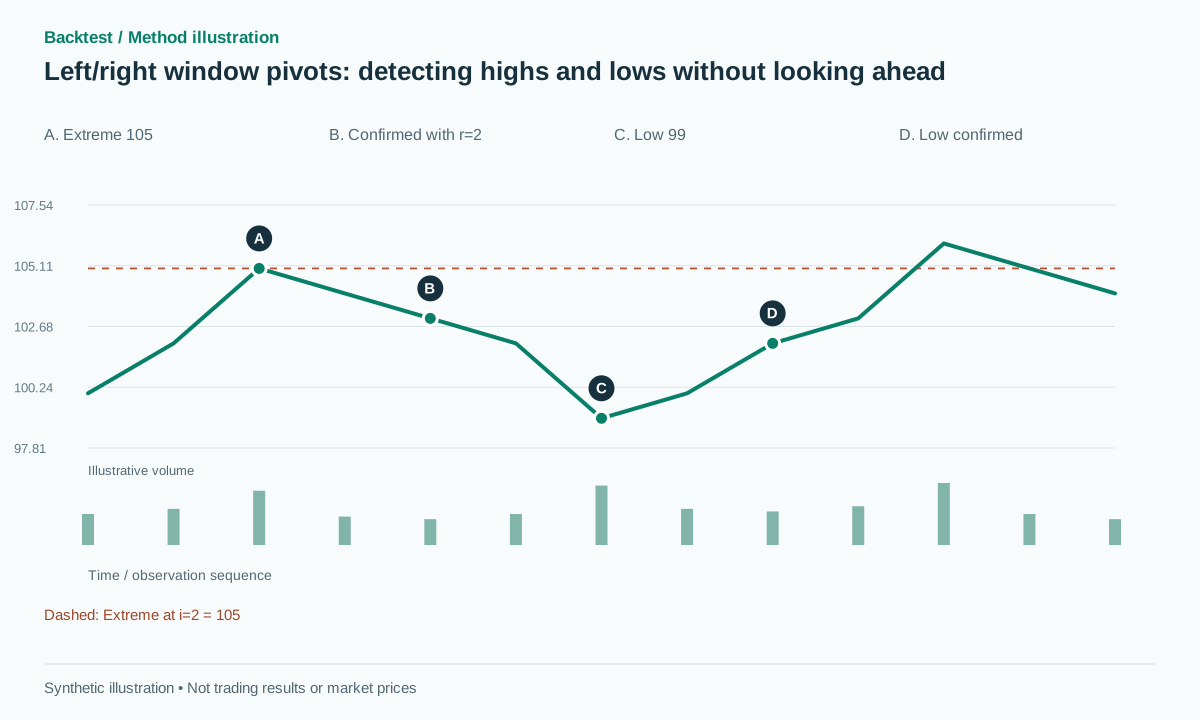
At bar i, a new high is only a candidate. With a right-hand window of r=3, three more bars must close before the detector can establish whether their highs remained below it. Store occurred_at=i and confirmed_at=i+3. A chart may draw the marker at i for readability, but an order using that event cannot exist before confirmation and the relevant data-processing delay.
TradingView describes two-sided pivot geometry [1] and warns that plotting a pivot in the past can misrepresent when it became known [2]. SciPy's find_peaks uses a different convention for flat plateaus [3]. Consequently, matching the final picture is insufficient when comparing implementations: their chosen anchors and available timestamps can differ.
A confirmed pivot remains a historical observation even if price later breaks its level. Treating every later breakout as proof that the old pivot was wrong confuses the definition of a local extreme with a forecast of permanent resistance. Store observations separately from hypotheses about their future use.
A deterministic definition with an explicit tie-break
The proposed baseline uses l=r=2 and chooses the rightmost point of equal highs. H[i] must be greater than or equal to every left-hand high and strictly greater than every right-hand high. Reverse the inequalities for lows. These parameters and tie-breaking rules are experimental settings rather than optimal values or an exact reproduction of a particular library.
Require l+r+1 valid bars with ordered, unique timestamps and a known trading calendar. If the window crosses missing data, record the reason and skip confirmation. Filling a missing interval with an invented flat trading bar can change both a plateau and its confirmation delay. A scheduled overnight closure is different from an unexplained missing bar.
Emit each event once, using an identifier containing instrument, timeframe, detector version, occurrence timestamp and type. If both high and low conditions hold on an outside bar, publish an ambiguous observation. A downstream pattern engine must not invent the order in which that bar reached its high and low.
on_closed_bar(t):
    i = t - r
    if i < l or window_has_missing_bar(i-l, t): return
    high_ok = H[i] >= max(H[i-l:i]) and H[i] > max(H[i+1:t+1])
    low_ok  = L[i] <= min(L[i-l:i]) and L[i] < min(L[i+1:t+1])
    if high_ok and low_ok: emit_ambiguous(i, confirmed_at=t)
    elif high_ok: emit_once('HIGH', i, H[i], confirmed_at=t)
    elif low_ok: emit_once('LOW', i, L[i], confirmed_at=t)
Numerical examples and cases that must fail
Synthetic highs 100, 102, 105, 104, 103 identify 105 at index 2. With l=r=2, the event becomes available only after index 4 closes. For hourly bars closing from 09:00 through 13:00, the extreme occurred at 11:00 and confirmation occurred at 13:00. An order based on that confirmation can be submitted only afterward.
Replace the final high with 106 and the candidate at 105 fails. No published pivot needs deletion because it was never confirmed. In 100, 102, 105, 105, 104, 103, the second 105 is selected by the proposed rightmost rule. Strict inequalities on both sides would reject the plateau, producing a different detector that must have a different version.
An outside bar with H=108 and L=95 can exceed neighboring highs while falling below neighboring lows. OHLC cannot establish whether 108 or 95 came first. Retain both facts or an ambiguity flag, but do not treat them as two ordered steps in a head-and-shoulders sequence. A useful test compares the same OHLC bar with two possible intrabar paths and checks that the bar-only detector never claims information unavailable from its input.
Turning anchors into a distinct trading hypothesis
The detector itself places no orders. One proposed experiment buys only after a future close crosses a confirmed pivot high plus a buffer, with buffer=max(2 ticks,0.1×ATR from before the trigger bar). Entry at the next executable opening event and a resting buy-stop are different execution models; choose one before measuring performance.
A previously confirmed pivot low can define a structural stop, while a fixed K-bar lifetime limits how long the high remains a candidate level. Do not record a breakout that supposedly occurred before the required anchor became available. If a different detector or delayed data means the level has already been crossed, either reject the stale setup or define a separate late-entry strategy.
Keep the raw pivot stream immutable. An alternating high–low representation is a downstream transformation: two consecutive highs may require merging or candidate replacement, but those operations must be versioned and timestamped. A previously published pattern cannot silently acquire a better anchor from later data. Explicitly record invalidation, expiration or creation of a replacement candidate.
Execution testing should include a gap between signal and fill, an unavailable short borrow for mirrored strategies, and a stop crossed before the next bar opens. A valid detector event can lead to no trade or to an uneconomic trade; those outcomes should remain distinguishable in the report.
Volume features belong to specific timestamps
Keep volume at occurred_at and volume at confirmed_at in separate columns. The former describes trading activity at the extreme; the latter describes activity during subsequent confirmation. A feature using the next three bars is available at confirmation, not retrospectively at the pivot bar. Its timestamp must follow the newest input it uses.
A proposed ablation compares the price-only setup with RVOL at the later trigger: current volume divided by the median of the previous 20 bars, with 1.5 as an experimental threshold. For intraday equities, a same-time-of-session baseline is usually a better-defined comparison than mixing opening activity with midday bars. FX tick volume measures provider-specific updates rather than automatically representing traded contracts.
Test whether volume adds information within comparable volatility and time-of-day groups. Otherwise a volume filter may merely select wide bars with higher execution costs. Log rejected opportunities too: evaluating only filled trades can hide that the filter removed most opportunities or changed exposure substantially.
Verify event correctness before evaluating returns
Replay every data prefix and compare all events published before its endpoint. Appending 100 bars must not change an old event's identifier, price, type or confirmation timestamp. Compare records rather than screenshots. Add fixtures for plateaus, outside bars, missing intervals, tick-size changes and prices below zero when the instrument permits them.
Measure pivots per 1,000 bars, confirmation delay, spacing between anchors and the proportion of downstream patterns that are already invalid by the time their last anchor is known. These diagnostics explain how detector changes alter the opportunity set before profit statistics are introduced.
Compare l=r=2 with 3 and 5 on development data and freeze the selection before the final test. Also test asymmetric windows as separately registered configurations. More visually attractive anchors do not establish greater net expectancy. The final trading evaluation must include spread, commissions, gaps, stop execution, position sizing and the opportunity cost of confirmation delay.
Common pitfalls
Entering exactly at a retrospectively marked extreme
A back-plotted marker is used as an order timestamp. Prefix replay exposes the unavailable information.
Confusing local pivots with session Pivot Points
Local extrema and the session-based P, R and S formulas are different tools with different inputs.
Choosing scale after viewing outcomes
Each l/r pair is a research trial. Retain failed variants as well as the selected configuration.
Checklist before using this method
Check each item after verifying it on your data. Progress is saved in this browser; it does not certify a profitable strategy.
Frequently asked questions
Does r=0 remove the delay?
It can create a past-only extreme detector, but there is no right-side reversal confirmation. It is a different signal and needs separate evaluation.
Can price break a confirmed pivot?
Yes. The historical extreme remains correctly identified; a later resistance break does not erase the observation.
Research sources
Each source supports the definition or evidence described beside it. The pseudocode, synthetic examples and proposed parameters require separate validation.
- Auto trendlinesTradingView. Read the two-sided pivot definition; commercial examples are not treated as profitability evidence. Checked: .
- Pine Script: RepaintingTradingView. Read the sections on plotting in the past and fluid, unfinished data. Checked: .
- scipy.signal.find_peaksSciPy. Read plateau and missing-data behavior; this is an API specification, not financial evidence. Checked: .
Related methods
Risk note
This content supports education and research design, not financial advice. Backtest is historical simulation, does not guarantee future performance and does not place real trades. Methods in this library are not automatically features available in the app. See methodology and learning center.
Validate rules before risking real capital
Check app support, data and individual simulated trades; advanced detectors may require a separate implementation.
Download Backtest on the App Store