Article contents
Evidence and scope
The cited material supports terminology and research context. The numerical thresholds, state machine, execution policy and synthetic examples below are proposed by this research project. No new backtest has been run, and the references do not establish profitability for this configuration.
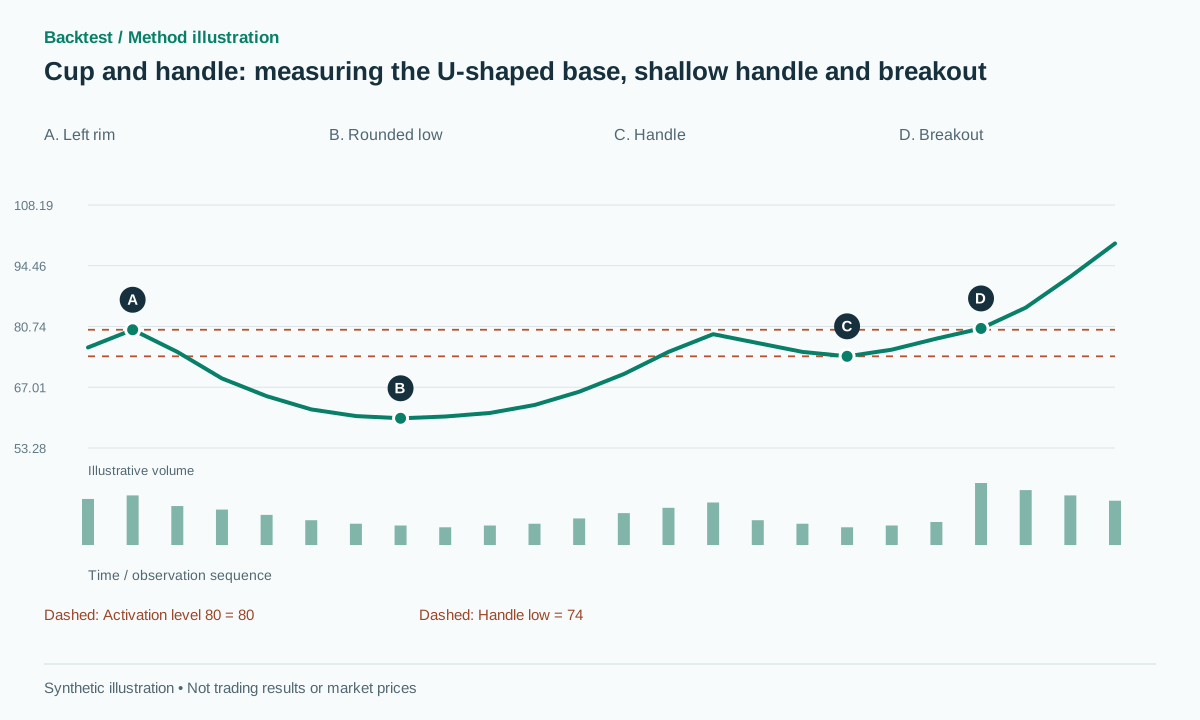 Open full-size illustration
Practical workflow
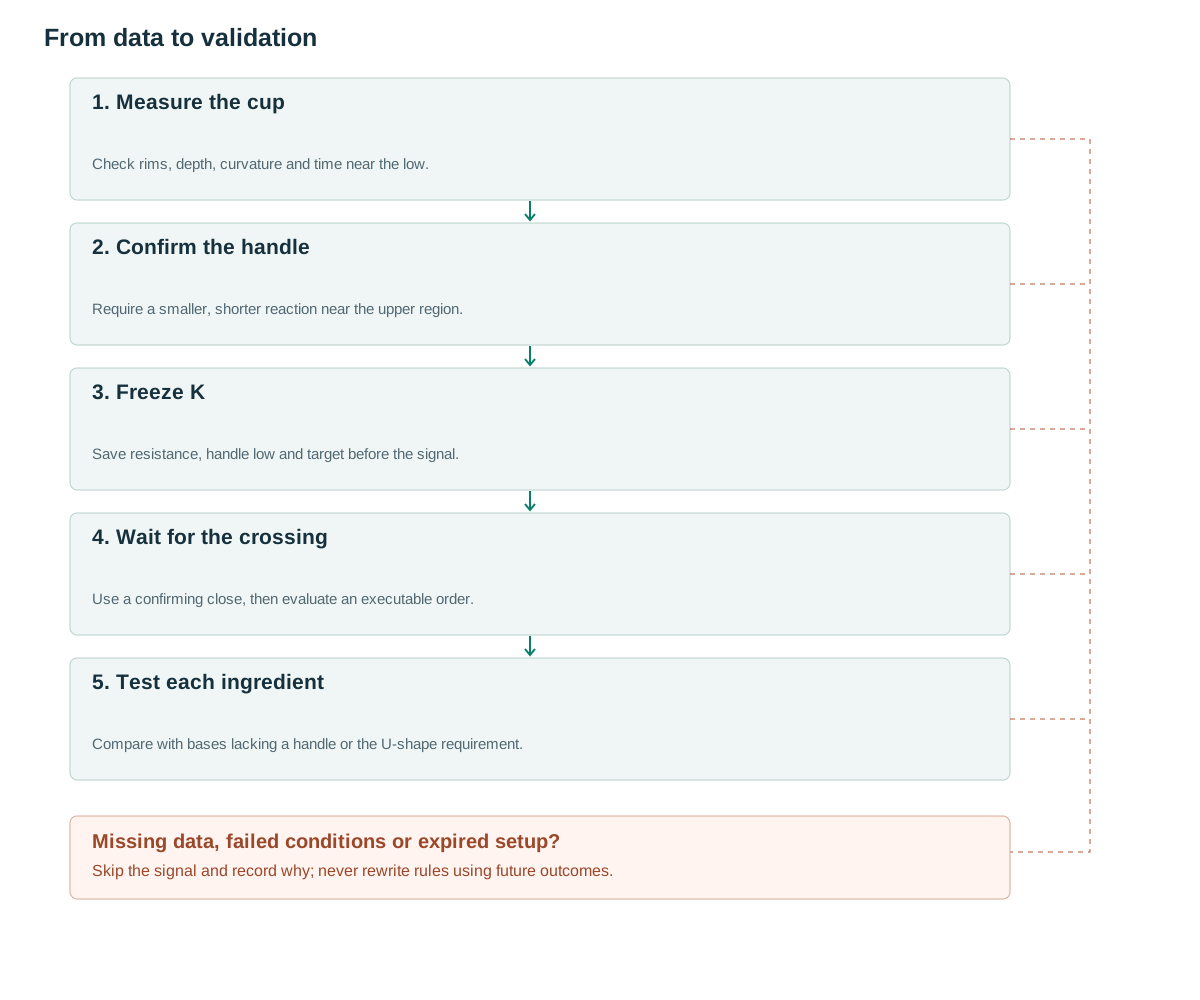
- Measure the cupCheck rims, depth, curvature and time near the low.
- Confirm the handleRequire a smaller, shorter reaction near the upper region.
- Freeze KSave resistance, handle low and target before the signal.
- Wait for the crossingUse a confirming close, then evaluate an executable order.
- Test each ingredientCompare with bases lacking a handle or the U-shape requirement.
What the structure tells us
The pattern combines a cup with a smaller pullback forming its handle before a breakout. [1] This article develops a geometric detector. It does not establish company quality or replace fundamental requirements in a broader investment system.
The cup represents a return toward an earlier trading region after a decline and recovery. The handle can provide a closer risk reference than the bottom of the cup. Claims that all weak holders have been removed cannot be established from shape alone; replace that narrative with measurements that can be accepted or rejected.
A detector should retain incomplete cups, cups without handles and handles that become too deep. Otherwise a dataset assembled from finished winners will conceal the opportunity cost of waiting and the frequency with which the proposed sequence never completes.
Rules using information already available
Proposed geometry: confirmed pivots with three bars on each side produce H1–L1–H2–L2, representing the two rims, cup low and handle low. Let R=(H1+H2)/2 and D=R−L1≥2A, where A=ATR(14) when the handle becomes confirmed. The rims may differ by no more than max(2epsilon,0.15D), with epsilon=max(2 ticks,0.15A). A prior uptrend before H1 is a separate context filter.
To measure the U, divide the cup into blocks of three to five bars, take median closes and normalize time u from zero to one. Fit y=au²+bu+c. Require a>0, vertex −b/(2a) between 0.25 and 0.75, and root-mean-square residual no greater than 0.2D. At least 15% of bars must lie below L1+0.25D. This proposed fit and dwell rule is not a formula attributed to IG.
Require handle depth between epsilon and 0.5D, with duration between 0.1 and 0.4 of cup duration. Define the activation level K=max(H1,H2,highest high within the handle). Freeze K when the handle has been confirmed, then seek a later close crossing K+buffer, where buffer=max(2 ticks,0.1A). Pivots cannot be backdated. [2]
Choose the block length and fitting procedure before testing. If the implementation tries many smoothing levels and selects whichever creates the prettiest U, the apparent precision hides additional model selection. Save residuals, vertex position, dwell count and handle measurements with every candidate.
when handle_low is confirmed:
  validate rims, cup_depth, quadratic_fit, bottom_dwell
  validate handle_depth and handle_duration
  freeze K,D,handle_low,A,created
for later closed t:
  if Low[t]<handle_low-epsilon: cancel candidate
  elif t>created+max(5,ceil(handle_duration)): expire
  elif C[t-1]<=K+buffer and C[t]>K+buffer:
    emit LONG; stop=handle_low-epsilon; target=K+D
# Inverted cups reverse geometry and comparisons; test their results separately.
Giving volume a specific job
A proposed volume layer measures median handle activity against the preceding base and measures RVOL at breakout. Quiet handle volume is a hypothesis worth testing, but one active session should not automatically disqualify every candidate. Continuous measurements help determine whether a stable relationship exists or a particular cutoff merely fits the past.
Increasing volume on the right side of the cup may accompany buying interest or simply greater volatility. Test price and volume features separately. If close location near the high is added, register it as another condition rather than treating it as part of the original definition. Adjust stock price and volume consistently for splits.
The handle and cup have different durations, so total volume is a poor default comparison. Use per-bar averages, medians or a clearly defined activity measure. Intraday adaptations additionally require session normalization; a lengthy daily base cannot be transferred to a few minutes merely by keeping the same bar counts.
Numerical examples and failure cases
Synthetic example: H1=80, L1=60, H2=79 and A=2. Then R=79.5 and D=19.5. The one-point rim difference is within the 2.925 tolerance. A 60-bar cup has a 12-bar handle reaching 74: handle depth is 5.5, below 9.75, and its duration ratio is 0.2. K=80; a close at 80.3 lies above K by more than the 0.2 buffer. An executable entry at 80.4, stop at 73.7 and target at 99.5 imply risk of 6.7 and reward of 19.1, approximately 2.85R before costs.
Recognition failure: a rapid fall from 80 to 60 followed by an immediate recovery to 79 spends almost no time near the low. The dwell condition rejects that V-shaped path. Trading failure: a fully qualified pattern enters at 80.4 and later reaches 73.7. Record the stopped trade; do not deepen the historical handle to 70 to preserve the label.
The numerical example assumes the curvature and residual checks also pass. Rim and handle arithmetic alone cannot establish the rounded shape. A test fixture should therefore supply an explicit price window for the fit rather than passing only four pivot values to a function that is supposed to distinguish U from V.
Entry, invalidation and exits
The baseline stop sits beyond the handle low and the target is K+D, frozen at the signal. Placing protection beyond the cup low is a substantially different risk policy. If the handle low has not been confirmed before the break, this version misses the opportunity; it cannot use a low confirmed later to justify an earlier entry.
An inverted cup requires the opposite curvature, an upward handle reaction, a downward trigger and protection above the handle. Do not assume symmetrical economic performance because short availability and gap exposure differ. For stocks, verify liquidity, adjusted data and corporate events before including a historical opportunity.
Entry occurs after close confirmation at a feasible quote. Recalculate available reward if the opening price gaps far above K. A pre-submission rejection is legitimate when declared limits fail; an already-filled order cannot be erased using later information. Keep the geometry unchanged while recording the execution outcome separately.
Testing incremental value
Compare with a long-base breakout that does not require a handle, and with a handle breakout that does not require U-shaped curvature. This separates the cost of waiting for a handle from the potential advantage of a closer stop. Test sensitivity to handle depth, cup duration and dwell without optimizing every stock independently.
For equities, use a point-in-time universe including delisted names where appropriate. Report rejected V shapes, insufficient-duration cases and liquidity exclusions. The methodological reference [3] does not validate this quadratic detector or establish its profitability.
Implementation tests should include a rounded U, a sharp V, a vertex near a window edge, mismatched rims and an excessively deep handle. Test the cancellation priority when one bar penetrates the handle stop region and closes above the trigger. Also verify scale consistency after a split adjustment and ensure that future bars cannot move the historical vertex, rim or handle used by an already-published candidate.
Common pitfalls
Calling every low a cup
A parabola can fit many paths; combine depth, residual and dwell checks.
Recognizing the handle only after success
Do not label a pause as a handle merely because a profitable breakout followed.
Borrowing the reputation of a broader system
A cup detector does not imply that CAN SLIM, fundamentals or relative-strength requirements have been satisfied.
Checklist before using this method
Check each item after verifying it on your data. Progress is saved in this browser; it does not certify a profitable strategy.
Frequently asked questions
Must both rims have exactly the same price?
No. This version uses a tolerance based on depth and ATR, then requires sensitivity testing around that choice.
Can entry occur before the rim breaks?
A handle-internal entry can be researched, but it is a different strategy with its own trigger and failure distribution.
Research sources
Each source supports the definition or evidence described beside it. The pseudocode, synthetic examples and proposed parameters require separate validation.
- IG: Cup and handle chart pattern explainedIG. Cup-and-handle structure and terminology; the public explanation was read. Checked: .
- TradingView: RepaintingTradingView. Pivot confirmation delay and repainting. Checked: .
- Lo, Mamaysky, Wang: Foundations of Technical AnalysisNBER / Columbia University. Background on systematic pattern research; this configuration is not tested by the paper. Checked: .
Related methods
Risk note
This content supports education and research design, not financial advice. Backtest is historical simulation, does not guarantee future performance and does not place real trades. Methods in this library are not automatically features available in the app. See methodology and learning center.
Validate rules before risking real capital
Check app support, data and individual simulated trades; advanced detectors may require a separate implementation.
Download Backtest on the App Store