Article contents
- Evidence and scope
- Illustration
- Process
- The closing-price direction signs the entire bar
- Calculate a normalized research feature
- Use the same timestamps for price and divergence
- A worked sequence and a counterexample
- Specify a testable breakout filter
- Ask whether volume adds information beyond price signs
- Common pitfalls
- Practical checklist
- Frequently asked questions
- Research sources
Evidence and scope
Fidelity documents the formula and conventional interpretation; TradingView documents the built-in indicator. Neither source validates the proposed 20-bar filters or divergence strategy below. These variants require independent tests after costs. [1] [2]
 Open full-size illustration
Practical workflow
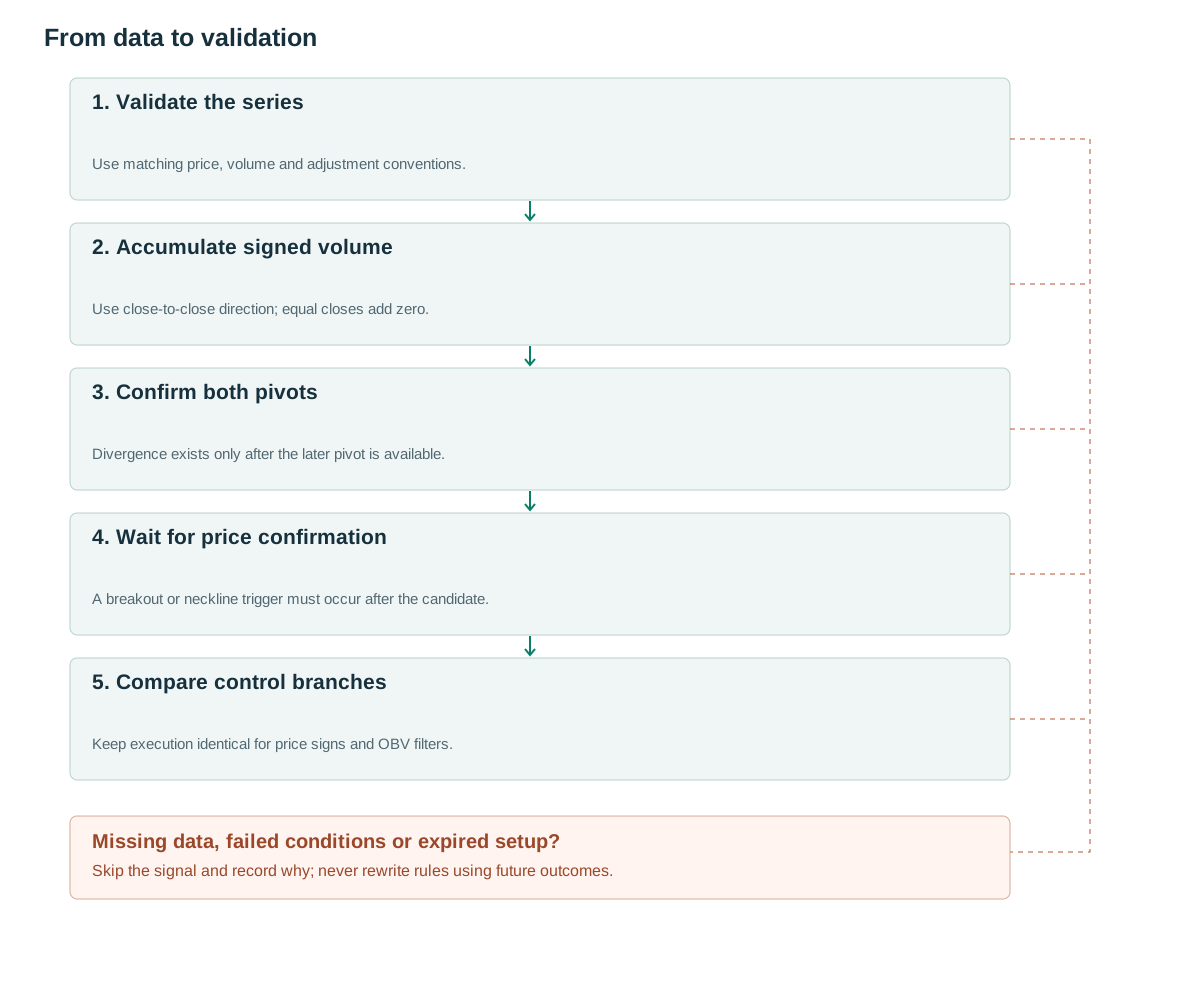
- Validate the seriesUse matching price, volume and adjustment conventions.
- Accumulate signed volumeUse close-to-close direction; equal closes add zero.
- Confirm both pivotsDivergence exists only after the later pivot is available.
- Wait for price confirmationA breakout or neckline trigger must occur after the candidate.
- Compare control branchesKeep execution identical for price signs and OBV filters.
The closing-price direction signs the entire bar
A rise of 0.01 and a rise of 5 both add the full bar volume. If their volume is equal, their contribution to OBV is identical despite very different returns. [1] OBV therefore describes how activity is distributed between periods classified as rising or falling; it does not measure the size of the price move.
The starting value may be zero or another arbitrary constant. Absolute readings across instruments or histories with different start dates are not directly comparable. Changes, slopes and positions within a rolling window are more useful research features. Every completed trade has a buyer and a seller; the name on-balance does not turn traded quantity into net capital entering an asset.
The standard sign uses the previous close, not the current open. A candle can close below its open while remaining above the previous close after an overnight gap. It contributes positively to standard OBV. A calculation based on candle color defines a different indicator and should have a separate name and configuration.
Calculate a normalized research feature
For comparison across instruments, one proposed feature divides the 20-bar OBV change by total volume over the same 20 contributions. With valid nonnegative volume and a positive denominator, this feature lies between −1 and 1. It is a new normalized feature rather than the original OBV level. Unchanged-close bars contribute zero to the numerator while their volume remains in the denominator.
Twenty signed contributions require 21 closing prices, including the close immediately before the window. An implementation that checks for only 20 prices may read a negative array index or silently use an incomplete initial difference. Require the complete warm-up explicitly and preserve missing values as unavailable rather than replacing them with an apparently neutral zero.
Compute features from completed bars, or define a separate live version with provisional observations. Persist the input cutoff and receipt timestamp with each signal. Corporate-action revisions can change historical signs, so the adjustment policy and dataset version must accompany any reported result.
obv[0] = 0
for t in 1..last_closed_bar:
    if C[t] > C[t-1]: obv[t] = obv[t-1] + V[t]
    elif C[t] < C[t-1]: obv[t] = obv[t-1] - V[t]
    else: obv[t] = obv[t-1]
if t >= 20 and valid_full_window(t,21) and sum(V[t-19:t+1]) > 0:
    f = (obv[t]-obv[t-20]) / sum(V[t-19:t+1])
else: f = NA
Use the same timestamps for price and divergence
Take two confirmed price lows, p1 and p2. A bullish-divergence candidate requires the second price low to be lower while OBV sampled at exactly those two timestamps is higher. The candidate exists only after p2 becomes confirmed. Do not choose a different OBV trough merely because it makes the example more attractive; any permitted time displacement needs a fixed pairing window and tie-breaking rule.
Divergence is a feature rather than an entry trigger. One proposed confirmation requires a subsequent close above the intervening rebound high. If that level was already crossed before p2 became available, record the candidate as missed or expired according to a predefined policy. Never insert a historical entry at a time when the second pivot was still unknown.
A slope filter and a divergence detector answer different questions. Rising OBV over the last 20 bars need not imply two appropriately matched troughs. Keep their identifiers separate and record which feature admitted the candidate. This makes later error analysis possible when two visual descriptions appear to agree but produce different event sets.
A worked sequence and a counterexample
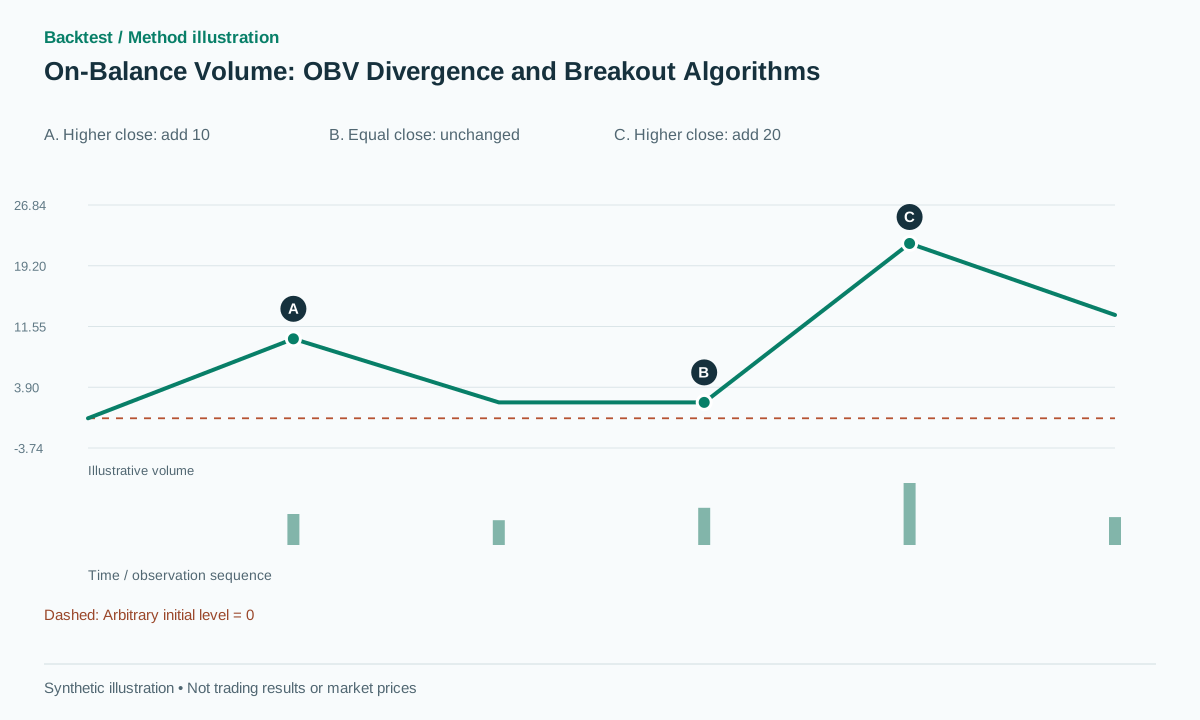
Consider closes of 100, 101, 100, 100, 102 and 101, with volumes from the second bar of 10, 8, 12, 20 and 9. Starting at zero, OBV becomes 0, 10, 2, 2, 22 and 13. The unchanged-close bar has volume 12 but leaves OBV unchanged. The illustration uses this exact signed-volume sequence.
For a counterexample, price falls from 101 to 95 on volume 10, then rises slightly from 95 to 95.01 on volume 100. OBV increases by a net 90 even though price remains almost 6% below its initial value. Concluding that buying pressure has recovered the entire price loss would attribute information to the formula that it does not contain.
A stock split can also create a mechanical close-to-close fall in an unadjusted feed. The algorithm would subtract volume despite the absence of a corresponding economic price decline. Audit prices and quantities around adjustment dates together; independently adjusted fields can produce a plausible-looking but inconsistent series.
Specify a testable breakout filter
A proposed baseline freezes Q as the highest high of the previous 20 bars and requires the current close above Q plus a predefined ATR buffer. One branch requires the normalized feature to exceed zero. Another requires OBV above its own previous 20-bar maximum. These are separate experiments, not reasons to search dozens of thresholds and publish only the strongest result.
Save every price candidate before applying OBV so the rejected group remains observable. Entry occurs at the next realistically executable event after confirmation. Use a predetermined structural or retest stop, with identical target and time-exit conventions in the control branch. A changing OBV reading never authorizes widening the stop.
For shorts, include actual borrowing constraints and costs where applicable. A symmetric mathematical rule does not imply symmetric implementability. Report unavailable borrow, missed fills and changing spread conditions alongside executed trades instead of quietly removing these opportunities from the denominator.
Ask whether volume adds information beyond price signs
Compare OBV with a simple count of up-close bars minus down-close bars. Similar results would suggest that volume weighting adds little in that sample. Then compare raw OBV change with its normalized version using the same universe, candidate timestamps and execution model. Inspect what happens when unusually large-volume bars enter or leave the window.
Use chronological out-of-sample evaluation and report results by liquidity group. Include spread, slippage and relevant financing. For cryptocurrency, identify the venue and volume source: the historical sample examined by NBER motivates data-quality checks but does not establish the same reporting bias for every present-day venue. [3]
Record net expectancy, drawdown, trade count and rejected opportunities, not just successful divergences. An informative negative result may show that OBV changes selection without improving net outcomes, or that an apparent benefit disappears under a one-event execution delay. Both conclusions are more useful than a gallery of winning charts.
Common pitfalls
Confusing candle color with the OBV sign
The standard sign compares consecutive closes; using close versus open defines a different indicator.
Comparing levels after resetting the series
The arbitrary initial value shifts the line without creating an economic signal.
Retrospective divergence entries
A visually convincing pair of pivots may not have been available at the proposed entry time.
Checklist before using this method
Check each item after verifying it on your data. Progress is saved in this browser; it does not certify a profitable strategy.
Frequently asked questions
Can OBV replace CVD?
No. OBV signs entire bars from closing prices; CVD needs a documented classification of executed trade volume.
Does rising OBV guarantee rising prices?
No. Price can fall substantially and then recover slightly on high volume. The relationship is an empirical hypothesis.
Research sources
Each source supports the definition or evidence described beside it. The pseudocode, synthetic examples and proposed parameters require separate validation.
- On Balance VolumeFidelity. OBV formula and conventional divergence interpretation, without a backtest of the proposed variants. Checked: .
- Built-in functions and variables for popular indicatorsTradingView. Product documentation for built-in OBV and MFI, not profitability evidence. Checked: .
- Crypto Wash TradingNBER. Historical research on reported cryptocurrency volume quality; no claim about a universal current error rate. Checked: .
Related methods
Risk note
This content supports education and research design, not financial advice. Backtest is historical simulation, does not guarantee future performance and does not place real trades. Methods in this library are not automatically features available in the app. See methodology and learning center.
Validate rules before risking real capital
Check app support, data and individual simulated trades; advanced detectors may require a separate implementation.
Download Backtest on the App Store