Article contents
- Evidence and scope
- Illustration
- Process
- More than a renamed RSI, less than observed capital flow
- A stable ratio and explicit boundary cases
- A worked calculation and a failed bottom call
- Separate reversal and trend-following versions
- Match MFI to causal price pivots
- Isolate what volume actually contributes
- Common pitfalls
- Practical checklist
- Frequently asked questions
- Research sources
Evidence and scope
Fidelity explains MFI and the limitations of extreme readings. TradingView documents its implementation as an indicator. Neither is a verified track record for the proposed entry rules, and the data-quality study addresses a historical exchange sample rather than every current feed. [1] [2] [3]
 Open full-size illustration
Practical workflow
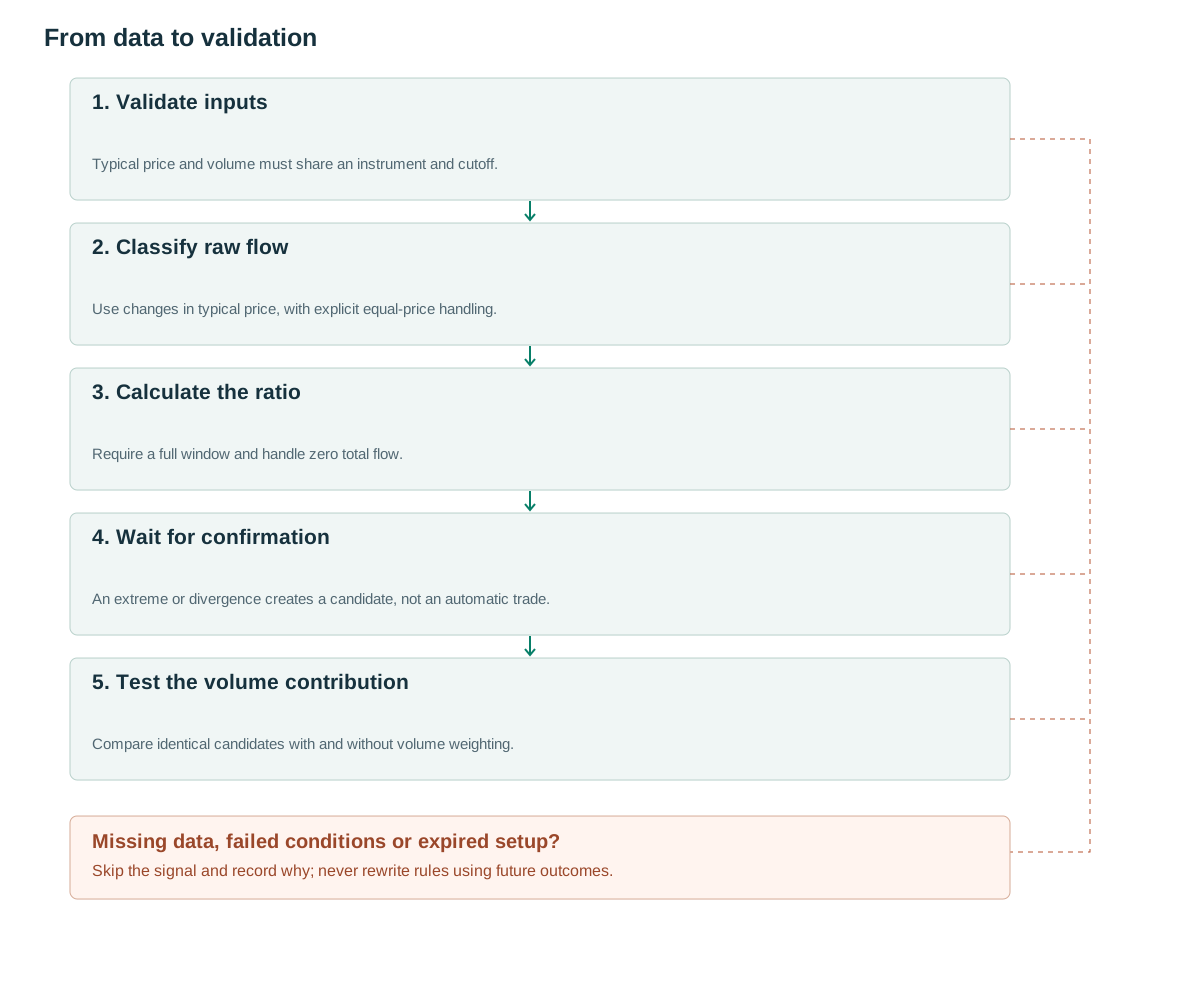
- Validate inputsTypical price and volume must share an instrument and cutoff.
- Classify raw flowUse changes in typical price, with explicit equal-price handling.
- Calculate the ratioRequire a full window and handle zero total flow.
- Wait for confirmationAn extreme or divergence creates a candidate, not an automatic trade.
- Test the volume contributionCompare identical candidates with and without volume weighting.
More than a renamed RSI, less than observed capital flow
Typical price is TP=(H+L+C)/3. Raw flow is TP multiplied by volume. Classify that flow as positive when typical price rises and negative when it falls. Negative flow is stored as a nonnegative magnitude for the ratio; it is not a negative number subtracted from the denominator. Under the convention used here, unchanged typical prices enter neither group.
Because volume enters the weight, MFI can differ from an RSI based only on closing-price changes. [1] A high-volume day may dominate several smaller observations. Nevertheless, MFI remains a transformation of OHLCV: it cannot identify aggressive buyers, new fund subscriptions or institutional accounts.
The term money flow can also obscure unit choices. Typical price times base-asset quantity resembles traded notional. Typical price times an already quoted currency turnover applies an additional price weight. Both can be calculated, but they are not interchangeable definitions. Store the source field and its units with the indicator configuration.
A stable ratio and explicit boundary cases
The common formula is 100−100/(1+P/N), equivalent to 100P/(P+N) when the total is positive. The latter avoids directly dividing by N when N is zero. If P is positive and N is zero, MFI equals 100; if P is zero and N is positive, it equals zero. If both are zero, this article returns unavailable data.
Fourteen classified bars require an additional preceding typical price to determine the direction of the first contribution. A complete warm-up therefore includes 15 OHLC observations for this calculation. Check for missing or invalid fields before constructing the sums; a missing bar must not silently become an unchanged-price observation.
Some platforms handle equal typical prices or initialization differently. Compare a small hand-calculated fixture bar by bar before comparing strategy performance. A harmless-looking convention difference can move a threshold crossing by one bar, which may materially change an intraday entry and stop distance.
Only completed observations enter this version. A live provisional MFI can be useful, but it needs a separate event definition because current volume, high and low can still change. Do not test the completed value while claiming that the strategy entered earlier during the same bar.
This version requires positive typical price, nonnegative volume and fifteen valid observations. Nonpositive futures prices can create negative raw flow, breaking the nonnegative-flow interpretation and the 0–100 range. Return unsupported_price_domain in that case instead of silently taking absolute values or changing the weight.
if not valid_full_window(t,15): return INSUFFICIENT_DATA
for i in t-14..t:
    if not finite(H[i],L[i],C[i],V[i]): return INVALID_DATA
    if not (L[i] <= C[i] <= H[i]) or V[i] < 0: return INVALID_DATA
    TP[i] = (H[i]+L[i]+C[i])/3
    if TP[i] <= 0: return UNSUPPORTED_PRICE_DOMAIN
for i in t-13..t:
    positive[i] = TP[i]*V[i] if TP[i] > TP[i-1] else 0
    negative[i] = TP[i]*V[i] if TP[i] < TP[i-1] else 0
P = sum(positive[t-13:t+1])
N = sum(negative[t-13:t+1])
MFI[t] = NA if P+N == 0 else 100*P/(P+N)
# 14 closed bars plus a previous TP are required.
# No decision uses an unfinished bar.
A worked calculation and a failed bottom call
Use three bars to expose the arithmetic, without changing the 14-period strategy setting. Typical price immediately before the window is 100. The next values are 101, 100 and 102, with volumes 10, 20 and 10. Positive flow P is 1010+1020=2030 and negative flow N is 2000. MFI is 100×2030/4030, approximately 50.37.
The larger volume on the falling-typical-price bar offsets two rising observations. Counting two rises and one fall alone would miss this weighting. Conversely, the result does not tell us whether buyers or sellers initiated the underlying transactions; the sign came from changes in typical price.
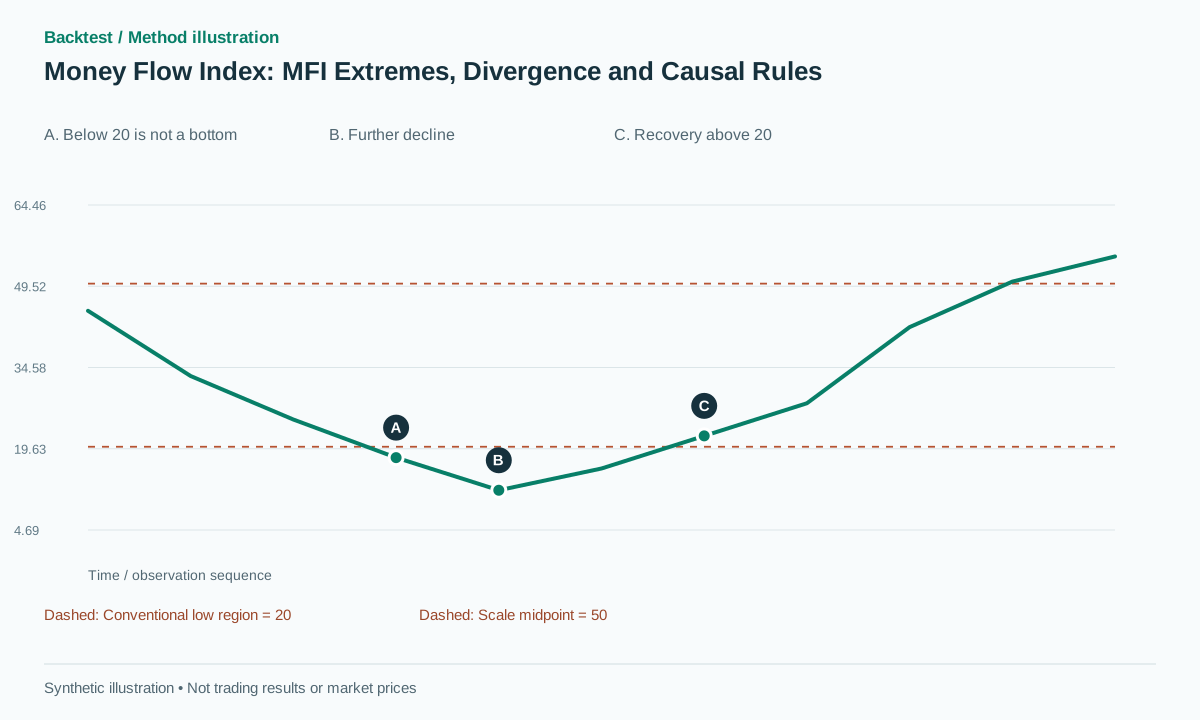
For a failed reversal example, MFI moves from 25 to 18 while price falls from 100 to 97. Buying solely because MFI is below 20 can suffer a further decline toward 92 while the oscillator remains around 10. An extreme does not establish exhaustion. Similarly, MFI above 80 can accompany a persistent uptrend; immediately shorting every crossing is a separate hypothesis. [1]
The synthetic illustration deliberately continues lower after the first sub-20 observation. It shows why candidate creation and entry confirmation should be different states. The oscillator value is not a probability: an MFI of 80 does not imply an 80% chance of any particular future move.
Separate reversal and trend-following versions
A proposed reversal version first requires MFI below 20. It then waits for a crossing back above 20 and a close above the previous bar high, inside a range regime identified from information available before the event. Entry is at the next executable event, with a stop below the event region. Cancel if confirmation does not arrive within five bars.
The threshold and timeout are research settings. Define whether a new lower reading restarts the clock or merely updates the same candidate. The simpler baseline uses one fixed event window and does not repeatedly restart it until a winning recovery appears. Record expired and invalidated candidates alongside confirmed ones.
A trend-following version instead preserves a higher-low price structure and treats an MFI pullback and recovery as a secondary feature. It need not require a reading below 20. Choose the versions before testing rather than calling the same visual event a trend trade when it wins and a mean-reversion trade when that description fits better.
Keep exit rules explicit and stable. Indicator recovery does not authorize widening a structural stop. A fixed reward target, trailing exit and time stop are different experiments; compare them without confusing improvements from exit selection with improvements from the MFI filter.
Match MFI to causal price pivots
Let p1 and p2 be confirmed price lows. A bullish-divergence candidate requires a lower second price low but higher MFI sampled at exactly those pivot timestamps. The event becomes available at the confirmation time of p2, then waits for a later price trigger. An alternative that searches for the minimum MFI near each pivot needs a fixed radius, delay and tie rule.
For example, low1=100 with MFI1=18 and low2=98 with MFI2=28 satisfy the proposed divergence comparison. If p2 needs two bars on its right, wait for both. A neckline break that happened before confirmation cannot be assigned as a retrospective entry. If price breaks the structural invalidation level before entry confirmation, cancel the candidate.
Log event time separately from availability time. On a chart these timestamps can look almost identical, but in a fast reversal the delay may consume most of the favorable move. A useful detector should expose this cost rather than hiding it behind a marker drawn at the earlier pivot.
Isolate what volume actually contributes
On the same price candidates compare RSI, MFI and a version of the MFI calculation with constant volume. This separates potential contributions from volume weighting, typical price and window selection. Optimizing RSI and MFI on unrelated samples does not isolate the effect of adding volume.
Split evaluation chronologically and report trend and range regimes separately using labels available at decision time. Include spread, slippage and borrowing costs for short variants. Track unavailable values, extremes without reversals, cancellations, trade frequency, drawdown and net expectancy rather than reporting only successful divergences.
Inspect the volume source before interpreting the result. The historical exchange-quality research in [3] motivates checks for suspicious or inconsistent activity; it does not supply a universal current error rate. A strategy whose advantage disappears on a cleaner feed should be described as data-sensitive rather than generalized to every market.
Common pitfalls
Buying every sub-20 reading
An oscillator can remain low while the price continues falling.
Confusing negative flow with negative arithmetic
Subtracting a signed negative total changes the intended ratio.
Entering at an unconfirmed pivot
The later bars needed for confirmation were not available at the pivot itself.
Checklist before using this method
Check each item after verifying it on your data. Progress is saved in this browser; it does not certify a profitable strategy.
Frequently asked questions
Is MFI just RSI with volume?
It is related in spirit, but this formula groups typical-price times volume rather than closing-price changes. Test the differences explicitly.
Does MFI identify money entering a market?
No. It classifies price–volume observations and does not directly measure account flows or trade aggressors.
Research sources
Each source supports the definition or evidence described beside it. The pseudocode, synthetic examples and proposed parameters require separate validation.
- Money Flow IndexFidelity. MFI definition, common interpretation and limits of extreme readings. Checked: .
- Pine functions for popular indicatorsTradingView. Pine indicator documentation, without a verified trading record. Checked: .
- Crypto Wash TradingNBER. Historical research on cryptocurrency volume quality, not a universal present-day correction. Checked: .
Related methods
Risk note
This content supports education and research design, not financial advice. Backtest is historical simulation, does not guarantee future performance and does not place real trades. Methods in this library are not automatically features available in the app. See methodology and learning center.
Validate rules before risking real capital
Check app support, data and individual simulated trades; advanced detectors may require a separate implementation.
Download Backtest on the App Store