Article contents
- Evidence and scope
- Illustration
- Process
- CMF measures closing location, not close-to-close direction
- Define flat bars and missing data before testing
- A three-bar calculation and a gap counterexample
- Test a breakout filter and a persistence variant separately
- Pair divergence with confirmed price pivots
- Use controls that isolate the value of volume weighting
- Common pitfalls
- Practical checklist
- Frequently asked questions
- Research sources
Evidence and scope
The definitions below are cross-checked against Fidelity, Sierra Chart and Chaikin Analytics. Accumulation and distribution are interpretations of a price–volume calculation, not direct observations of participant identity or validated returns for the proposed setup. [1] [2] [3]
 Open full-size illustration
Practical workflow
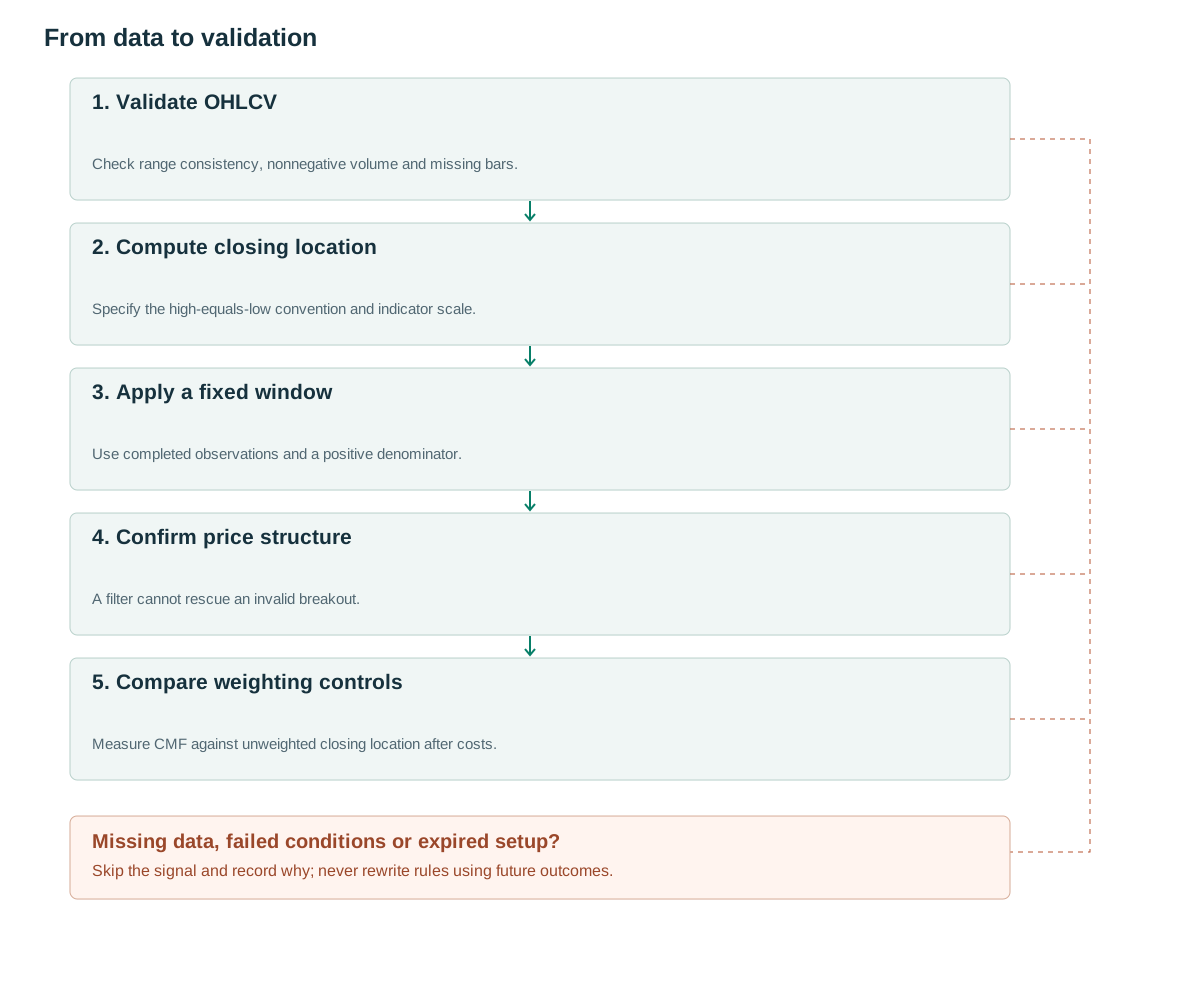
- Validate OHLCVCheck range consistency, nonnegative volume and missing bars.
- Compute closing locationSpecify the high-equals-low convention and indicator scale.
- Apply a fixed windowUse completed observations and a positive denominator.
- Confirm price structureA filter cannot rescue an invalid breakout.
- Compare weighting controlsMeasure CMF against unweighted closing location after costs.
CMF measures closing location, not close-to-close direction
OBV signs volume according to the change from the previous close. CMF asks whether the current close is in the upper or lower part of its own range. When H exceeds L, the multiplier is (2C−H−L)/(H−L): +1 at the high, −1 at the low and zero at the midpoint. [1] A day that falls relative to yesterday can therefore contribute positively if it finishes near its own high.
CMF divides the sum of multiplier times volume by total volume over a rolling window. This article uses the scale from −1 to 1. Some products multiply the result by 100; Chaikin Analytics describes a scale of ±100. [3] A threshold of 0.05 on the first scale corresponds to 5 on the second. Importing a threshold without its unit can make a filter admit almost everything or almost nothing.
The multiplier describes the final location inside a range. It does not reconstruct the path taken through that range or the side initiating each trade. Two bars with identical high, low, close and volume produce identical CMF contributions even if their transaction sequences and order-flow histories were very different.
Define flat bars and missing data before testing
When high equals low, the original fraction is undefined. The proposed convention here sets the multiplier to zero while retaining the bar volume in the denominator. This represents no directional evidence from closing location. Another platform may omit the bar or use a different rule; record the convention and examine sensitivity where flat bars occur frequently.
Reject invalid high below low, closes outside the recorded range and negative volume. A zero total-volume denominator produces an unavailable value rather than a neutral zero. Fidelity gives 21 periods as a commonly used setting. [1] [2] Alternative windows of 10, 20 or 50 are separate research choices that belong in the experiment record.
For a completed-bar implementation, availability begins after the entire window and current closing observation are received. Maintain running numerator and denominator sums for efficiency, but test them against a simple full-window calculation. Small subtraction errors can accumulate over long streams, especially when the data contain very large and very small quantities.
for i in full_window(t, n=21):
    assert L[i] <= C[i] <= H[i] and V[i] >= 0
    multiplier[i] = 0 if H[i] == L[i] else (2*C[i]-H[i]-L[i])/(H[i]-L[i])
denominator = sum(V[i] for i in full_window(t,21))
cmf[t] = NA if denominator == 0 else sum(multiplier[i]*V[i] for i in full_window(t,21))/denominator
filter_ok = cmf[t] > 0.05  # proposed threshold, scale -1..1
A three-bar calculation and a gap counterexample
Use a short window only to illustrate the arithmetic. Bar A has H=110, L=100, C=108 and V=100, giving a multiplier of 0.6. Bar B has H=112, L=102, C=104 and V=200, giving −0.6. Bar C has H=L=C=105 and V=100, giving zero under the stated flat-bar rule. CMF is (60−120+0)/400=−0.15.
If the flat bar were removed from both numerator and denominator, the result would instead be −0.20. Neither value can be compared with a platform output until its convention is known. This small test belongs in the implementation checks because the difference can change threshold crossings.
Now suppose yesterday closed at 110 and today gaps down before trading with H=101, L=99 and C=100.8. The multiplier is positive 0.8 even though the closing price fell 9.2. CMF does not directly measure the loss through the gap. A system that treats every positive reading as bullish could buy into a substantial decline.
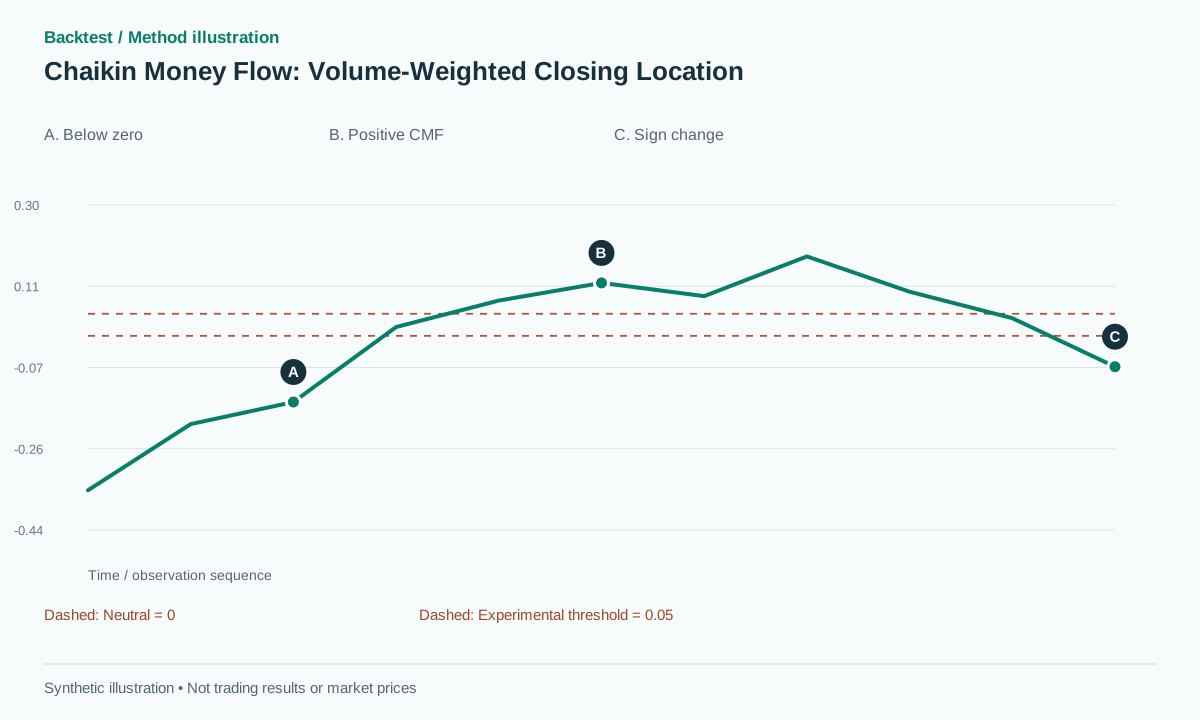
The chart displays a separate synthetic CMF path crossing a proposed threshold and subsequently weakening. Its vertical values are indicator units. They are neither prices nor percentages of profitable trades, and the illustration is not a historical performance sample.
Test a breakout filter and a persistence variant separately
Freeze resistance using a previous window or confirmed pivots. When price closes above it, compare two proposed filters: current CMF above zero, or at least four of the most recent five CMF observations above zero. The second measures persistence rather than a single point. Four and five are experimental settings, not an attributed original rule.
Entry occurs at the next executable event after the close. Place the stop at a structural invalidation level already known at that time. If the baseline uses a 2R target and a 20-bar time exit, retain those conventions in the branch without CMF. Otherwise selection and exit changes become mixed, making the comparison difficult to interpret.
A positive reading does not override a failed price structure. Cancel the candidate when its original invalidation condition occurs. If confirmation arrives after the time limit, record an expired opportunity rather than retrospectively extending the window. Short-side tests need their own execution and borrowing assumptions.
Overlapping persistence windows are highly dependent. Four positive observations in five bars are not four independent votes from different sources. Avoid converting a count of correlated observations into an unsupported probability or confidence score.
Pair divergence with confirmed price pivots
A proposed bullish divergence uses two confirmed price lows: the second price low is lower, while CMF sampled at that same timestamp is higher. Do not independently select an attractive CMF trough without first defining the matching tolerance. The candidate appears only when the later price pivot is confirmed and still requires a subsequent price trigger.
CMF is a rolling ratio. A large-volume observation leaving the window can change its sign even when the current bar is ordinary. Log the entering and departing numerator contributions to explain a crossing. This mechanical effect is not necessarily evidence of a newly arriving flow of money.
When testing a divergence alternative, use the same pivot detector, confirmation delay and pairing policy as the price-only control. Otherwise an apparent benefit may come from different event timing rather than the indicator. Retain candidates that fail before confirmation so the visible winners do not become the entire sample.
Use controls that isolate the value of volume weighting
Compare CMF with an unweighted average of the same closing-location multipliers on identical price candidates. This directly asks whether weighting by volume adds useful information beyond the location of closes. Only then add RVOL as another experiment; two volume-derived quantities should not automatically count as independent confirmations.
Report results separately for gap days, flat-bar incidence and windows dominated by a few large-volume observations. Freeze the window length and thresholds before the final chronological test. Include spread, slippage and realistic next-event execution, then show net expectancy, frequency and drawdown.
A successful calculation is not a successful strategy. Verification should first establish that the arithmetic and availability timestamps are correct, then evaluate predictive usefulness on unseen observations. Green indicator regions on a winning stock do not supply a representative sample or demonstrate an investable edge.
Common pitfalls
Positive CMF after a large gap down
A high closing location can coexist with a large close-to-close loss.
Ignoring the observation leaving the window
A sign change may result from an old contribution expiring rather than unusual current activity.
Treating accumulation as an observed identity
The formula cannot establish that institutions bought or that net money entered the asset.
Checklist before using this method
Check each item after verifying it on your data. Progress is saved in this browser; it does not certify a profitable strategy.
Frequently asked questions
Is CMF the same as OBV?
No. CMF uses closing location inside the current range; OBV uses the direction between consecutive closes.
Does CMF above zero validate a breakout?
It supplies a testable feature. Whether it improves net outcomes depends on the event definition, market and execution costs.
Research sources
Each source supports the definition or evidence described beside it. The pseudocode, synthetic examples and proposed parameters require separate validation.
- Chaikin Money FlowFidelity. Definition, formula, common 21-period setting and conventional interpretation. Checked: .
- Chaikin Money Flow — Studies ReferenceSierra Chart. Platform implementation of the CMF calculation. Checked: .
- Chaikin Money FlowChaikin Analytics. Provider documentation explaining its ±100 scale and price–volume interpretation. Checked: .
Related methods
Risk note
This content supports education and research design, not financial advice. Backtest is historical simulation, does not guarantee future performance and does not place real trades. Methods in this library are not automatically features available in the app. See methodology and learning center.
Validate rules before risking real capital
Check app support, data and individual simulated trades; advanced detectors may require a separate implementation.
Download Backtest on the App Store