Article contents
- Evidence and scope
- Illustration
- Process
- Volume selects the stock; price supplies direction
- Separate the paper's configuration from implementation choices
- A state machine prevents retroactive entries
- Allocated capital is different from total account equity
- Synthetic success, failure and ambiguous bars
- Read public results within their actual scope
- Common pitfalls
- Practical checklist
- Frequently asked questions
- Research sources
Evidence and scope
For 2016–2023, the authors report +1,637% total return, 41.6% IRR, 2.81 Sharpe and 12% maximum drawdown, with $0.0035 commission per share and no separate slippage model. These are reported research results, not a new replication or an audited account. [1]
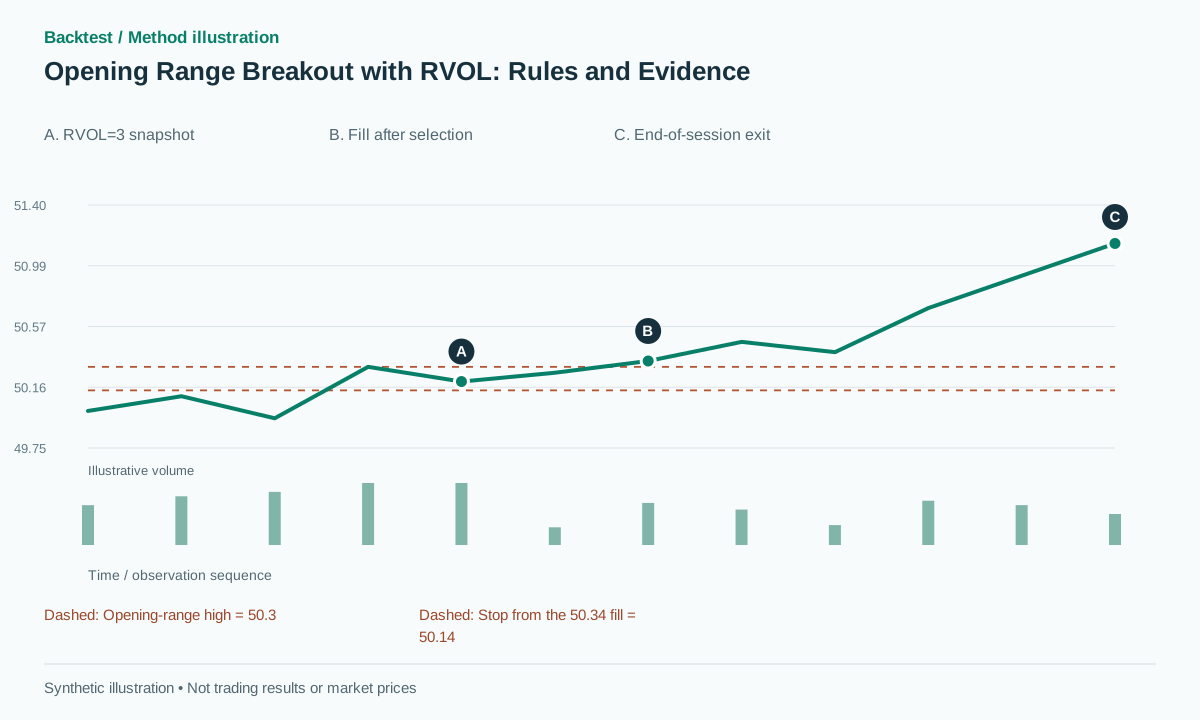 Open full-size illustration
Practical workflow
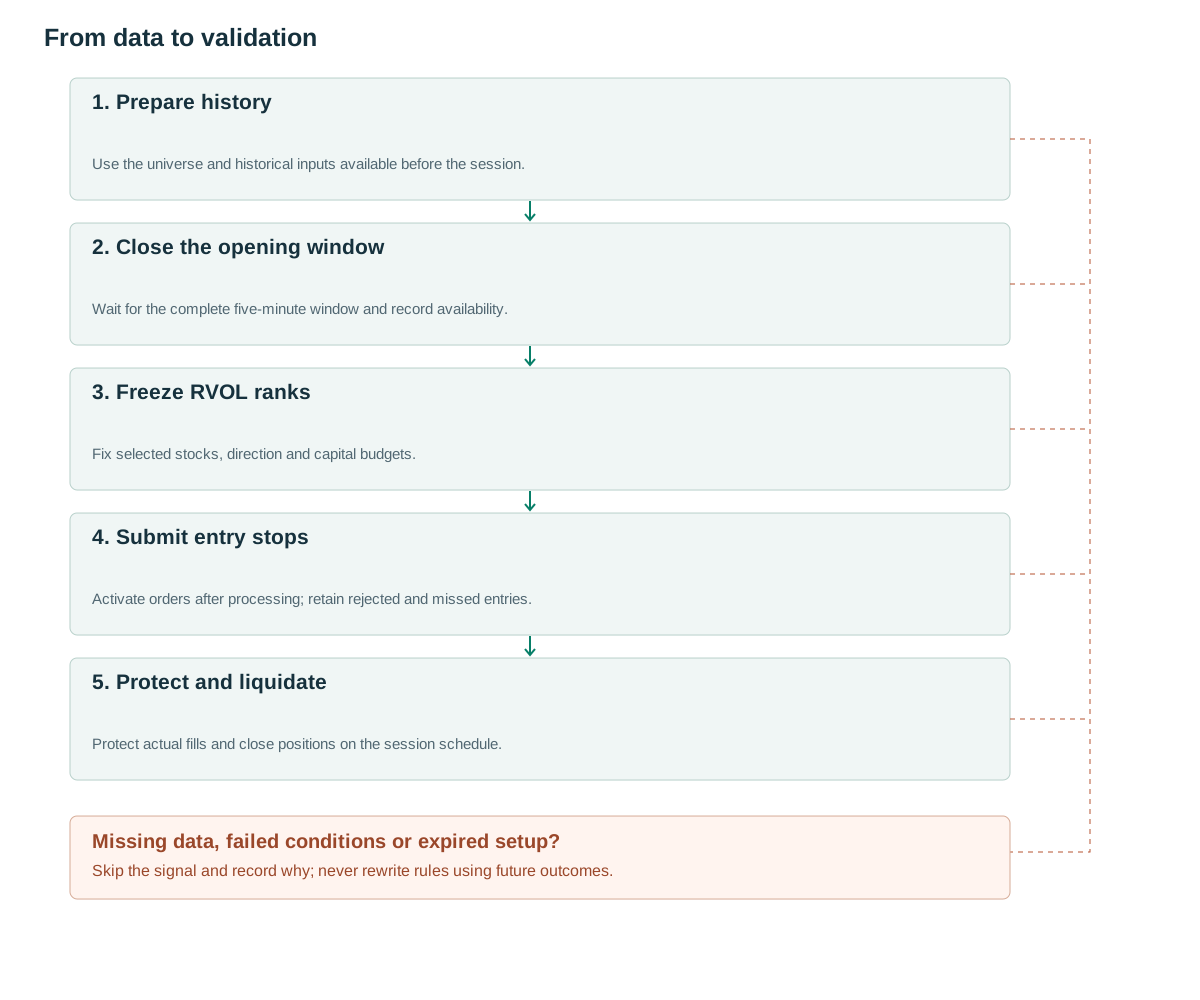
- Prepare historyUse the universe and historical inputs available before the session.
- Close the opening windowWait for the complete five-minute window and record availability.
- Freeze RVOL ranksFix selected stocks, direction and capital budgets.
- Submit entry stopsActivate orders after processing; retain rejected and missed entries.
- Protect and liquidateProtect actual fills and close positions on the session schedule.
Volume selects the stock; price supplies direction
Many stocks move sharply during the opening minutes. The testable proposition is that a breakout has different conditional behavior when trading activity is unusually high relative to that stock's normal opening activity. Relative volume does not identify a buyer or seller: every completed trade has both. Direction must come from a separate price rule, while volume measures the intensity of participation.
Define opening relative volume as RVOL(d) = V(d, opening window) / mean(V(d−j, same window), j=1…14). The denominator must be available from earlier sessions. Comparing the first five minutes with an average full-day volume answers a different question and introduces incompatible time units. TradingView distinguishes cumulative volume from volume at a matching time; an implementation must choose one definition consistently. [3]
An RVOL of four does not imply four times the expected return of an RVOL of one. High activity can accompany news, wider spreads, a halt or a reporting correction. A stock with a tiny usual opening volume can also receive a spectacular ratio on modest absolute activity. Eligibility filters and an execution assessment therefore belong upstream of the final trading decision.
The economic contribution of the volume filter is an empirical question. Test the same price rule with and without RVOL while holding risk and exposure comparable. Otherwise, a better equity curve could merely reflect fewer trades or larger positions in the selected group.
Separate the paper's configuration from implementation choices
The reference configuration uses opening price above $5, prior 14-day average volume of at least one million shares, ATR14 above $0.50, and the top 20 stocks with five-minute RVOL at least one. A green opening candle sets a long breakout; a red candle sets a short breakout; a doji is skipped. The stop is 0.1 ATR from the fill, positions close intraday, risk is 1% of allocated capital and leverage is capped at four times. [1]
The following engineering conventions are proposed specifications, not additional claims from the paper. Use the exchange calendar in America/New_York, including daylight-saving changes and shortened sessions. Missing historical windows are unavailable observations, not zero-volume days. A delayed opening bar is usable only when its data have actually arrived.
Freeze a selection snapshot containing the universe, opening OHLC, daily ATR, the 14 historical volume observations and the final rank. Break equal ranks using a stable instrument identifier. Do not add a stock to the selected set after observing its breakout. If only 12 stocks qualify, retaining the unused allocation or redistributing it must be decided before evaluating returns.
The snapshot should retain both event time and availability time. A vendor can timestamp a bar at 09:35 while delivering a correction later. Reconstructing all decisions from the final corrected history would describe a different information set from the one available to the original order process.
A state machine prevents retroactive entries
An entry order exists only after selection, processing and submission. A price crossing that occurred before this sequence cannot fill the new order. If the market is already beyond the trigger when a stop-market order becomes active, it may execute immediately near the current market; assigning the earlier trigger price would invent a favorable fill.
Build the protective stop from the actual entry fill. Partial fills require protection for the quantity already filled, plus a policy for the unfilled remainder. A short-sale rejection, unavailable borrow or broker risk rejection is a recorded system outcome. Silently removing those cases can make the surviving trade sample look easier to execute than the real opportunity set.
Maintain explicit states such as selected, submitted, partially filled, protected, closed and rejected. Every transition needs a timestamp and quantity. This makes it possible to inspect whether a protective order could have acted during a rapid reversal immediately after entry.
on_opening_range_ready(session):
    snapshot = freeze_available_data(session)
    candidates = rank_eligible_by_rvol(snapshot)
    selected = candidates[:20]
    for asset in selected:
        side = sign(asset.or_close - asset.or_open)
        if side == 0: continue
        trigger = asset.or_high if side > 0 else asset.or_low
        submit_stop_after_processing_delay(asset, side, trigger)
on_entry_fill(fill):
    stop_distance = 0.1 * frozen_daily_atr[fill.asset]
    protective_stop = fill.price - fill.side * stop_distance
    protect_filled_quantity(fill, protective_stop)
on_session_liquidation_deadline():
    cancel_pending_entries()
    close_remaining_positions()
Allocated capital is different from total account equity
Consider a synthetic $100,000 account divided into 20 capital budgets of $5,000. Risking 1% of one allocation means $50 per stock. Accidentally interpreting the rule as 1% of the entire account means $1,000 per stock: a twentyfold change before any discussion of leverage. This distinction matters when comparing implementations that use similar strategy names.
With a $0.20 stop distance and no costs yet included, a $50 loss budget permits 250 shares. At a $50 stock price, the notional is $12,500, exceeding the $5,000 cash allocation. Actual size must therefore satisfy the minimum of the risk limit, notional limit, borrowing availability and remaining portfolio capacity.
A portfolio leverage ceiling is not permission to size every concurrent trade at that ceiling. Reserve exposure for submitted orders and release it upon cancellation or rejection. Otherwise, individually valid orders can collectively breach the limit when several fill at once.
Also distinguish planned stop loss from realized tail loss. Correlated stocks may gap through their stops simultaneously. Report the planned portfolio loss if all stops fill as specified, then stress wider spreads, delayed protection and adverse gaps. Twenty tickers do not guarantee twenty independent risks.
Synthetic success, failure and ambiguous bars
Suppose the opening range has O=50, H=50.30, L=49.90 and C=50.20. Opening volume is 600,000 shares against a 200,000-share historical mean, so RVOL=3. Prior daily ATR is 2. After selection is ready, the buy-stop at 50.30 fills at 50.34. The protective stop is 50.14. An end-of-day sale at 51.14 earns $0.80 per share, or 4R before costs when R=$0.20 per share.
With the same initial setup, a reversal could instead fill the stop at 50.10. The loss is $0.24 per share, or 1.2R before commission. It must not be forced back to −1R because the intended stop level was 50.14. The difference is exactly the execution exposure that a narrow stop can magnify.
If the vendor later revises opening volume from 600,000 to 150,000, preserve the original received value and the revision separately. A live decision based on the former cannot be evaluated as though the latter had been known at selection time.
A single OHLC bar can contain both entry and stop prices without revealing their order. Use finer data or report conservative and optimistic bounds. Choosing the winning intrabar sequence is not a neutral simplification. A useful unit test constructs two tick paths with identical OHLC and checks that the simulator acknowledges their different outcomes.
Read public results within their actual scope
The public QuantConnect implementation reports a 2016 test with a 1,000-stock universe and Sharpe 2.396. Its discussion identifies differences between the initial Python version and the C# implementation. [2] It is a useful replication starting point, but it does not independently verify the entire eight-year study.
Preserve the paper's IRR label. A regression alpha is not CAGR, and a portfolio hit ratio cannot be relabeled a per-trade win rate without establishing its denominator. Differences in return conventions can produce different annualized figures even when a headline total return is similar.
A proposed ablation uses A: price-only ORB; B: ORB plus the RVOL threshold; C: threshold plus top-20 ranking. Compare opportunity counts, accepted orders, actual fills, turnover and net results on the same locked evaluation calendar. Report costs relative to each trade's R, not only as a small percentage of notional.
Before comparing final equity curves, compare daily eligible universes, selected symbols, trigger times and quantities. A mismatch here is a rules or data problem; tuning slippage to make the final return match would conceal it. A credible reproduction documents remaining discrepancies and then evaluates a genuinely untouched period.
Common pitfalls
Ranking the open with end-of-day information
Full-session volume is unavailable at 09:35. Using it to select opening trades creates look-ahead bias.
Combining narrow stops with unrealistically small costs
A few cents of spread or slippage can consume a large fraction of R. Report the distribution of cost in risk units.
Delaying protection by one bar
Creating the stop a bar after entry can miss an immediate reversal. Model the entry-to-protection sequence with actual processing assumptions.
Checklist before using this method
Check each item after verifying it on your data. Progress is saved in this browser; it does not certify a profitable strategy.
Frequently asked questions
Does high RVOL mean informed investors are buying?
No. It measures unusual completed trading activity. Direction and participant identity require different evidence.
Can the opening range be changed to 15 minutes?
Yes, as a separately tested variant. Match the historical volume window to 15 minutes and account for later entries, different stops, costs and the additional research trial.
Research sources
Each source supports the definition or evidence described beside it. The pseudocode, synthetic examples and proposed parameters require separate validation.
- A Profitable Day Trading Strategy For The U.S. Equity MarketZarattini, Barbon, Aziz — 16/02/2024. Full PDF read; Table 2 is on physical PDF page 17, printed page 16. Results use the authors' assumptions; no new backtest was run. Checked: .
- Opening Range Breakout for Stocks in PlayDerek Melchin — QuantConnect. Article, example code and implementation discussion read. The code was not executed. Checked: .
- Relative Volume at TimeTradingView. Primary documentation defining same-time relative volume. It does not establish ORB profitability. Checked: .
Related methods
Risk note
This content supports education and research design, not financial advice. Backtest is historical simulation, does not guarantee future performance and does not place real trades. Methods in this library are not automatically features available in the app. See methodology and learning center.
Validate rules before risking real capital
Check app support, data and individual simulated trades; advanced detectors may require a separate implementation.
Download Backtest on the App Store