Article contents
- Evidence and scope
- Illustration
- Process
- Answer four different questions in order
- 1. Point-in-time data and the meaning of volume
- 2. Confirmation times and prefix invariance
- 3. An order must exist before it can fill
- 4. Risk sizing must use consistent units
- 5. Walk-forward evaluation, purging and embargo
- 6. Ablation, multiple trials and stress tests
- 7. Metrics, expectancy and levels of evidence
- Publish artifacts that another researcher can inspect
- Common pitfalls
- Practical checklist
- Frequently asked questions
- Research sources
Evidence and scope
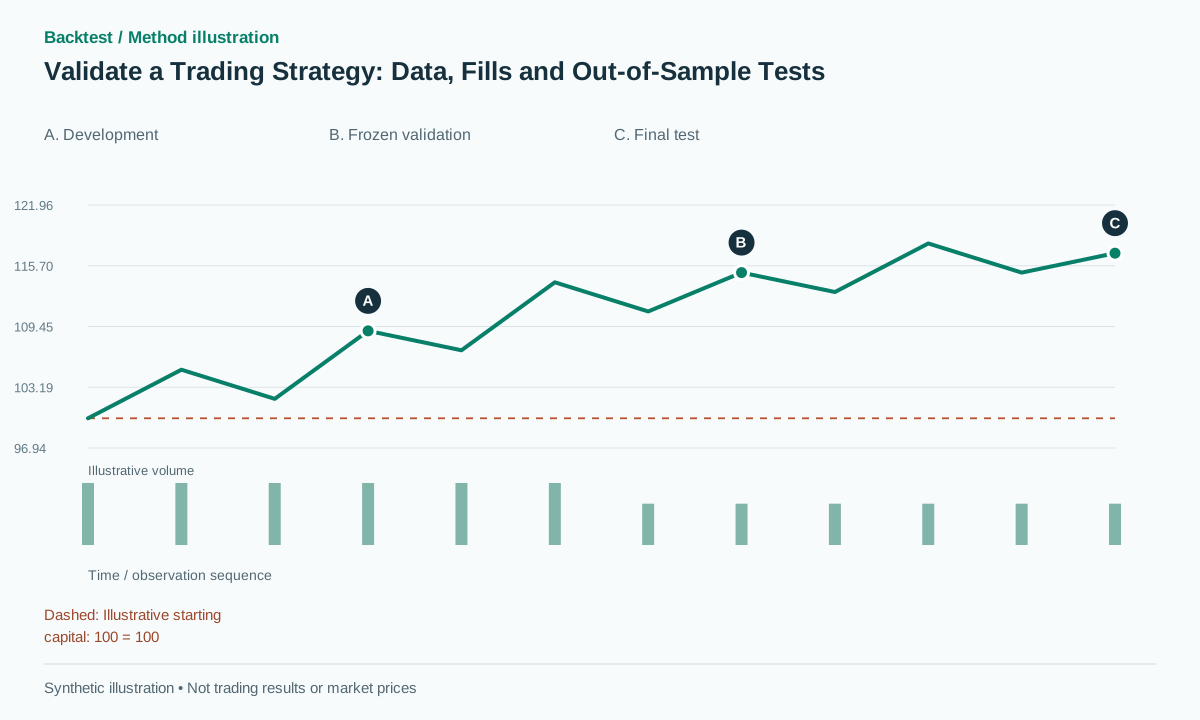
This article proposes a validation workflow, not a profitable strategy or a new backtest. The cited sources address pattern inference, simulation mechanics and statistical overfitting; none certifies the profitability of every method in this library.
 Open full-size illustration
Practical workflow
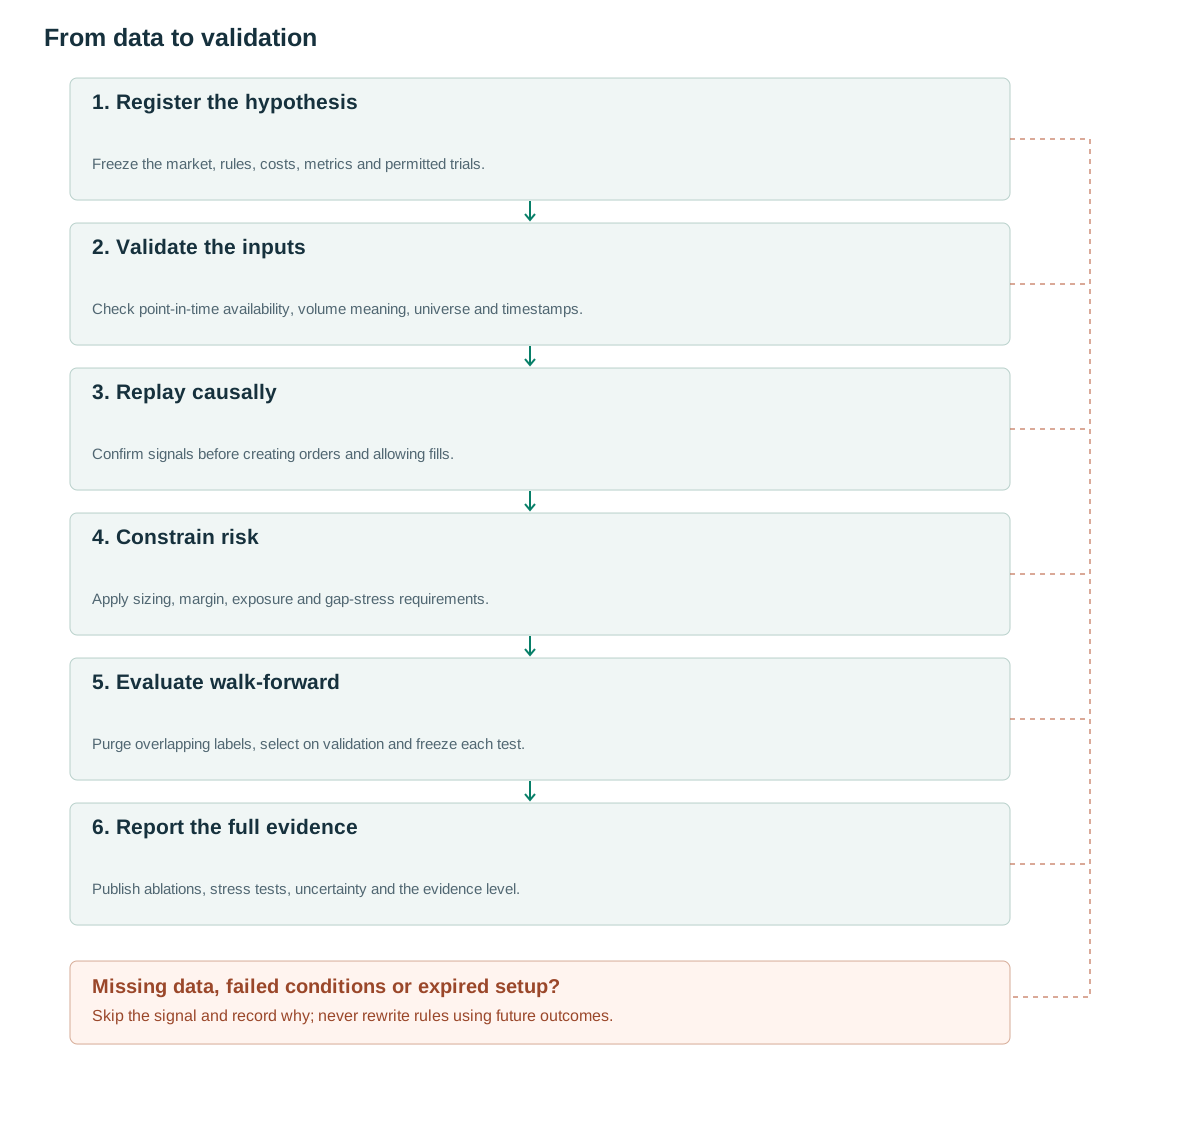
- Register the hypothesisFreeze the market, rules, costs, metrics and permitted trials.
- Validate the inputsCheck point-in-time availability, volume meaning, universe and timestamps.
- Replay causallyConfirm signals before creating orders and allowing fills.
- Constrain riskApply sizing, margin, exposure and gap-stress requirements.
- Evaluate walk-forwardPurge overlapping labels, select on validation and freeze each test.
- Report the full evidencePublish ablations, stress tests, uncertainty and the evidence level.
Answer four different questions in order
First, can the pattern be recognized consistently? Second, does it contain conditional information about subsequent outcomes? Third, can that information be converted into positive net account returns with feasible orders? Fourth, does the result persist on genuinely unseen data? A study answering one question must not be presented as answering all four.
Formal pattern research demonstrates how recognition and statistical inference can be investigated. [1] A visually convincing double top or a statistically different return distribution is not yet a complete trading system. Entries, exits, costs, position sizing and the opportunity set still determine economic results.
Write a hypothesis card before inspecting performance. Include the eligible market, timeframe, input fields, formation rule, confirmation delay, entry and exit mechanics, risk budget, costs, benchmark, evaluation metric and permitted parameter variations. The card should be precise enough for another person to implement without interpreting chart aesthetics.
Also define a useful negative result. For example, a volume filter may add no incremental net expectancy after matching exposure. Recording that outcome prevents a research process from quietly replacing the original question whenever a preferred result fails.
1. Point-in-time data and the meaning of volume
Distinguish when an event happened, when the data were received and when the strategy could use them. A bar timestamp alone may not reveal a delayed feed, a correction or publication latency. Historical simulations should reconstruct the relevant information set rather than use the latest corrected database indiscriminately.
Keep stable instrument identifiers, historical membership and corporate-event records. Today's surviving stocks are not yesterday's investable universe. Handle delistings, ticker reuse, new listings and unavailable prices explicitly. For corporate actions, effective dates and announcement dates can answer different availability questions.
Use raw tradable prices for fills and a documented adjustment convention for signals. A continuous futures series may be useful analytically, but a fill must occur in a real contract at a real price. Roll transactions, multipliers and contract expiry cannot be inferred from a smooth stitched chart.
Volume is market-specific. Exchange share volume, futures contract volume, FX tick counts and a crypto venue's traded quantity are different measurements. A label such as buying volume or delta requires an actual classification method; ordinary OHLCV does not reveal participant identity or all-market order flow.
Create integrity tests for duplicate bars, missing intervals, impossible OHLC relationships, negative volume and timezone discontinuities. Preserve dataset versions and correction logs. A reproducible codebase with changing unversioned inputs does not produce a reproducible experiment.
2. Confirmation times and prefix invariance
A pivot at index i requiring r bars to its right is confirmed no earlier than i+r. Its location can be drawn at i for analysis, but a trading decision cannot occur there retrospectively. Store occurred_at and confirmed_at as separate fields and execute from the later available timestamp.
Prefix invariance is a practical test: run the algorithm on each growing prefix of the dataset and compare already published confirmed events. Appending future observations must not rewrite them. Provisional candidates may change if they are explicitly labeled provisional; confirmed historical signals should remain stable under unchanged inputs.
Higher-timeframe inputs need the same discipline. Join a completed hourly value to a minute strategy only after the hourly observation is available. A current unfinished hour's eventual high, low or close cannot be supplied to earlier minute decisions.
Fit normalizations, clustering parameters and statistical models on the permitted historical partition. A scaler trained on the entire dataset leaks future distribution information even when every individual trade entry is delayed correctly. Causality applies to preprocessing as well as indicators.
An informative test deliberately alters future prices and volumes while keeping the historical prefix fixed. If an earlier confirmed signal changes, trace the dependency rather than assuming the charting platform has solved repainting automatically.
3. An order must exist before it can fill
Represent the sequence from signal to order creation, submission, acceptance, trigger, partial fill and completion or cancellation. Latency may exist at each stage. A historical price touch that preceded order acceptance is not an available fill for that order.
Platform strategy documentation helps identify emulator timing and order assumptions. [2] Those mechanics are simulator conventions, not a guarantee of actual exchange execution. A stop-market order constrains activation, while its eventual price can differ; a limit order constrains price but may not fill. [3]
OHLC bars do not reveal the order of intrabar events. If entry, stop and target all lie inside one bar, use finer data or disclose outcome bounds. Do not select whichever path improves the strategy. A resting order also cannot be canceled after observing the unfavorable fill that its existence allowed.
Model partial fills and pending quantities. If a protective stop is created only after entry, state how long the position can remain unprotected. If an entry is reversed before completion, reconcile actual exposure and outstanding orders rather than assuming every requested target was reached.
Costs include commission, spread, slippage, market impact, borrow and applicable funding or financing. Charge them at their actual contractual times. Do not impose a universal funding interval on all crypto products, and do not add spread again when bid/ask fills already include it.
4. Risk sizing must use consistent units
For a linear instrument, a proposed size formula is q=floor(B/(abs(E−S)×multiplier+c_unit)), where B is the cash loss budget, E the planned entry, S the stop and c_unit an estimated round-trip cost per unit. Currency conversions must put numerator and denominator in the same account currency.
This formula estimates planned loss; it does not cap a gap loss. Inverse contracts, options and nonlinear products require their own payoff calculation rather than borrowing a stock-share formula. Minimum lot sizes and broker margin may reduce the feasible quantity further.
Consider synthetic equity of $20,000 and risk of 0.5%, giving B=$100. With entry 100, stop 99.50 and cost estimate $0.04 per share, q=floor(100/0.54)=185. The planned loss including that cost is $99.90.
If the exit instead fills at 99.20, the price loss is $148 and the same estimated cost is $7.40, totaling $155.40. A report that clips this loss to the intended $100 budget erases execution risk rather than measuring it.
At portfolio level, reserve exposure for open orders, constrain gross and net notional and aggregate correlated risks. Several individually small positions can respond to the same market shock. Report both planned stop risk and stressed loss under simultaneous adverse moves.
5. Walk-forward evaluation, purging and embargo
Separate development, validation and evaluation by time. Fit models on training data, choose permitted settings using validation data, then freeze the configuration before evaluating the next test segment. Repeating this chronological process measures an updating procedure rather than a single hindsight-selected setting.
Labels can overlap boundaries. If a training example's outcome extends into the validation or test interval, remove that example from the training fold. Likewise, validation labels used for selection should not include outcomes from the test interval. Record each label's start and end rather than purging a guessed fixed number of rows.
An embargo excludes nearby observations where the cross-validation design would otherwise allow future-side training samples to share information with a test interval. It is not a universal substitute for chronological separation and does not repair incorrect feature timestamps. The cited author presentation discusses these mechanisms; it is not evidence that every arbitrary embargo length is sufficient. [4]
Keep an additional final holdout if the research process repeatedly inspects walk-forward results. Once those results guide revisions, they have influenced development. Select the final configuration using development information only, then evaluate the locked holdout once and report it without retuning.
Every fitted transform belongs inside the fold: scalers, feature selection, regime thresholds and volume baselines that require estimation. A carefully purged label split can still leak if a preprocessing step was fit on the full sample.
6. Ablation, multiple trials and stress tests
Ablation asks what each component adds. Compare price-only, price plus RVOL and price plus RVOL plus VWAP using the same opportunity universe, sizing and execution assumptions. Separately change entry and exit logic when both use the new indicator; otherwise the source of an improvement remains unclear.
Maintain a trial registry including failed ideas, manual chart filters, timeframes, datasets, parameter grids and market subsets. Reporting only the final successful configuration hides the number of chances the researcher had to discover a lucky result.
The Deflated Sharpe Ratio addresses selection bias and non-normal return behavior under its assumptions. [5] It is not a probability that a strategy will make money live. The Probability of Backtest Overfitting concerns rank deterioration across partitions in its framework, not a direct probability of losing account capital. [6]
Stress execution costs at predeclared multiples such as 1.5 and 2, delay entries by one bar, test nearby parameters and examine dependence on the largest five trades. These are proposed sensitivity tests. A trend strategy naturally relies on large winners; deleting them is informative but is not an automatic pass-or-fail rule.
Examine regime and capacity sensitivity with enough observations to support the comparison. Splitting the data into many tiny favorable regimes creates another selection problem. A simple stable effect after costs is usually more persuasive than an elaborate explanation built around a few exceptional periods.
7. Metrics, expectancy and levels of evidence
Report the number of opportunities, submitted orders, fills, completed trades and profitable days separately. A filter can improve trade win rate while excluding many profitable opportunities. A profitable-day frequency is not a trade win rate, and neither determines expected return without payoff sizes.
Compute drawdown from a marked-to-market equity series that includes open positions and costs. State return frequency for Sharpe rather than treating irregular trade returns as interchangeable with daily returns. Preserve the distinction between total return, CAGR, cash-flow-sensitive IRR and regression alpha.
A synthetic strategy with win probability 0.40, average winner 2R, average loser 1R and cost 0.08R has expectancy 0.40×2−0.60×1−0.08=0.12R. Its break-even win rate under those fixed payoffs is (1+0.08)/(2+1)=0.36.
Another synthetic strategy winning 65% of trades, earning 0.5R on winners and losing 1R otherwise with the same cost has expectancy 0.65×0.5−0.35×1−0.08=−0.105R. A higher win rate can therefore coexist with a losing system.
Include tail losses, time under water, turnover, participation, exposure and uncertainty intervals. Distinguish a descriptive method, author-reported backtest, code-and-data reproduction, independent review, forward paper trading and verified live evidence. These stages answer progressively different questions; none implies a guaranteed future return.
Publish artifacts that another researcher can inspect
Archive the hypothesis version, input-data versions, trial registry, fold boundaries, signal events, order events, fills, costs and equity calculations. A final performance table without the intermediate ledgers is difficult to diagnose when another implementation disagrees.
The pipeline below separates the repeatedly used development period from a final holdout. Its functions are specifications to implement and test, not executable proof of correctness. In particular, purging must inspect label intervals and execution must respect actual event availability.
A useful review package includes at least one successful example, one failed trade, one rejected order and one ambiguous intrabar case where available. Explain the simulator's handling of each. This provides concrete evidence that the rules operate consistently when outcomes are inconvenient.
Freeze publication metrics before reading the final holdout. If the final result disappoints, report it and begin a new research version with a new evaluation plan. Repeatedly editing the same method against the same supposed holdout destroys the very evidence that the holdout was meant to provide.
spec = freeze_hypothesis_and_trial_registry()
data = load_versioned_point_in_time_inputs()
assert_data_integrity(data)
assert_confirmed_events_are_prefix_invariant(data)
development, final_test = split_chronologically_before_research(data)
for fold in chronological_folds(development, spec):
    train = purge_overlapping_labels(fold.train, fold.validation + fold.test)
    validation = purge_overlapping_labels(fold.validation, fold.test)
    model = fit_using_train_only(train)
    config = select_on_validation(model, validation)
    freeze(config)
    events = replay_causally(fold.test, config)
    fills = simulate_orders_after_available_at(events, spec.execution)
    equity = mark_to_market(fills, fees=spec.costs)
    archive_all_results(config, events, fills, equity)
final_config = freeze_selection_using_development_only()
evaluate_final_holdout_once(final_test, final_config)
report_net_metrics_ablations_stress_and_uncertainty()
Common pitfalls
Treating an attractive detector as a profitable strategy
Geometry, predictive information, execution and out-of-sample performance are separate validation stages. Passing one does not establish the others.
A clean-looking chart with future-confirmed signals
Drawing a pivot at its historical location can conceal a later confirmation time. Store both occurred_at and confirmed_at, and test every decision against information availability.
Compressing every cost into a small commission
Spread, impact, borrow or funding and missing fills can matter more than commission. Model them for the instrument and its liquidity.
A realistic fee line with unrealistic fills
Commission cannot compensate for impossible signal-close fills, favorable intrabar ordering or guaranteed limit execution.
Repeatedly inspecting the same test period
Once test results guide revisions, that period becomes part of development. Record each use and preserve a new untouched evaluation stage.
Saving only the winning configurations
Without the number of trials and the distribution of failed variants, the evidence for the selected strategy can be overstated.
Using statistical corrections as profitability certificates
DSR, PBO and p-values address specific inference questions under assumptions. They do not replace execution testing or establish future account profits.
Checklist before using this method
Check each item after verifying it on your data. Progress is saved in this browser; it does not certify a profitable strategy.
Frequently asked questions
How many trades are enough to prove a strategy works?
There is no universal threshold. Dependence, payoff tails, market regimes and effect size determine uncertainty. Report those features rather than treating a fixed trade count as proof.
Should a strategy be rejected if costs remove the reported edge?
The tradable version may fail while the underlying statistical relationship remains useful. Report both conclusions and avoid presenting the gross effect as an executable net return.
Does publishing code make a backtest reproducible?
Code is only one requirement. Data versions, corporate-action conventions, parameters, trial history and execution assumptions also need to be available or precisely documented.
Research sources
Each source supports the definition or evidence described beside it. The pseudocode, synthetic examples and proposed parameters require separate validation.
- Foundations of Technical Analysis: Computational Algorithms, Statistical Inference, and Empirical ImplementationAndrew W. Lo, Harry Mamaysky, Jiang Wang. Original pattern-recognition and statistical-inference research read. It does not demonstrate profitability for every library rule. Checked: .
- Pine Script — StrategiesTradingView. Primary documentation read for strategy order timing and broker-emulator behavior, not as a universal exchange execution model. Checked: .
- Understanding Order Types — Investor BulletinU.S. SEC — Investor.gov. Primary bulletin read for market, limit and stop-order mechanics and their execution limitations. Checked: .
- MLX 2018 — The 7 Reasons Most Machine Learning Funds FailMarcos López de Prado — bản trình bày đăng trên SlideShare. Author's presentation slides read for purging and embargo. This does not claim access to or reading of the complete financial machine-learning book. Checked: .
- The Deflated Sharpe Ratio: Correcting for Selection Bias, Backtest Overfitting and Non-NormalityDavid H. Bailey, Marcos López de Prado — 2014. Full methodological paper read. Its selection-bias adjustment requires assumptions and trial information; it is not a live-profit probability. Checked: .
- The Probability of Backtest OverfittingBailey, Borwein, López de Prado, Zhu. Methodology read for CSCV and PBO. Out-of-sample rank deterioration is distinguished from the probability of losing money. Checked: .
Related methods
Risk note
This content supports education and research design, not financial advice. Backtest is historical simulation, does not guarantee future performance and does not place real trades. Methods in this library are not automatically features available in the app. See methodology and learning center.
Validate rules before risking real capital
Check app support, data and individual simulated trades; advanced detectors may require a separate implementation.
Download Backtest on the App Store