Article contents
- Evidence and scope
- Illustration
- Process
- An average traded price, not guaranteed support
- The event time and the knowledge time
- Cumulative calculation and frozen conditions
- A calculation by hand and two failure examples
- A pullback needs recovery and invalidation
- Add volume without counting the same information twice
- Test anchor rules, not the best-looking lines
- Common pitfalls
- Practical checklist
- Frequently asked questions
- Research sources
Evidence and scope
Platform documentation and Brian Shannon’s slides explain calculation, anchor selection and pullbacks. They do not establish an independently verified return series for the proposed algorithm below. A touch of VWAP is not automatically a profitable trade. [1] [2] [3]
 Open full-size illustration
Practical workflow
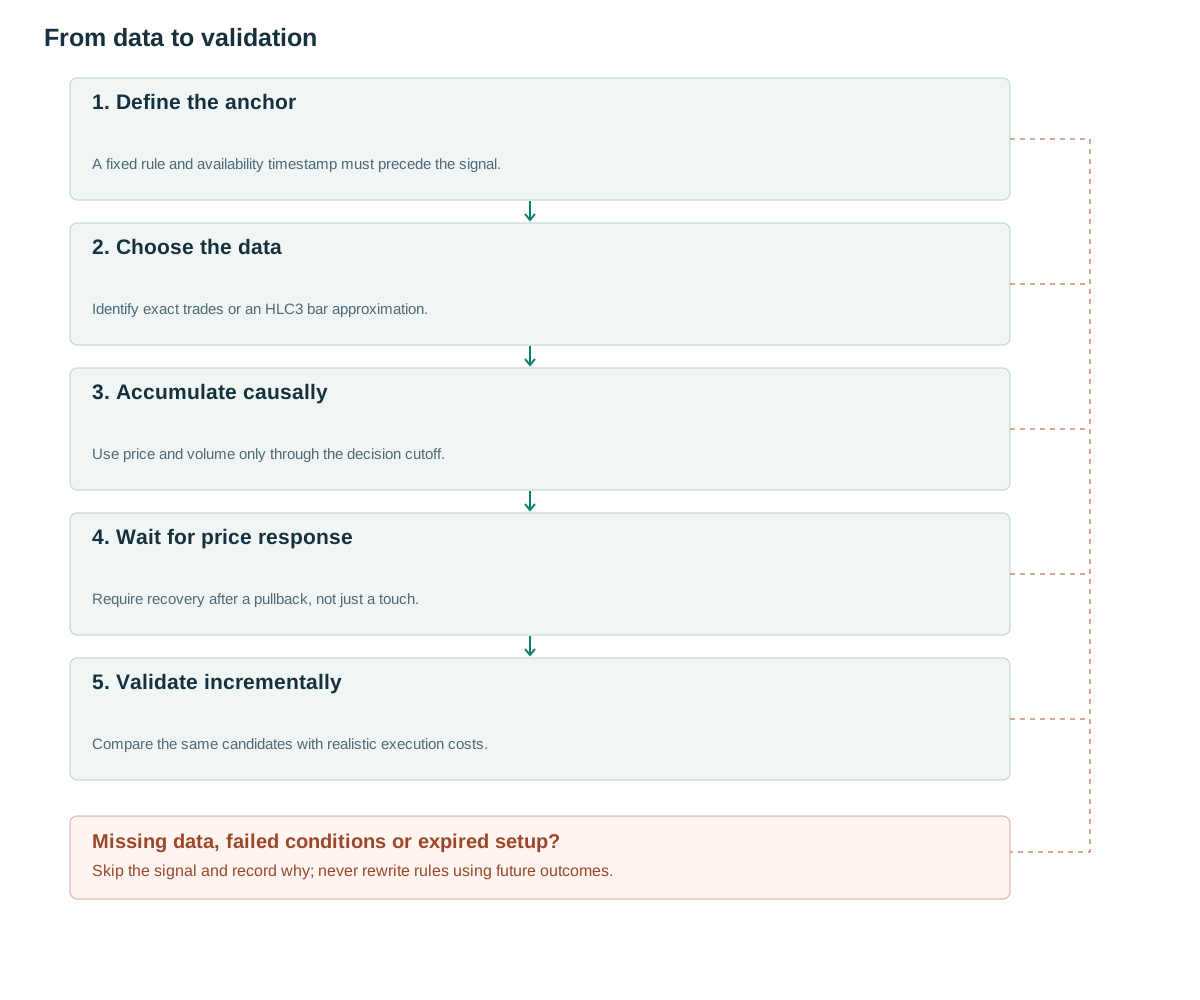
- Define the anchorA fixed rule and availability timestamp must precede the signal.
- Choose the dataIdentify exact trades or an HLC3 bar approximation.
- Accumulate causallyUse price and volume only through the decision cutoff.
- Wait for price responseRequire recovery after a pullback, not just a touch.
- Validate incrementallyCompare the same candidates with realistic execution costs.
An average traded price, not guaranteed support
Exact trade VWAP divides the sum of traded price times quantity by total quantity. Many chart implementations replace individual trades with each bar’s HLC3 multiplied by volume. That approximation can change when the bar interval changes. TradingView documents a bar-based calculation and selectable reset periods. [1]
An anchor may be a fixed session start, an already published earnings event, a confirmed breakout or a confirmed swing. Shannon’s slides use meaningful anchors and slope, and do not treat every touch as an automatic purchase. [3] Distance from the line describes location relative to the selected sample. It does not reveal the exact cost basis of a particular group of market participants.
Anchoring is a modeling decision. A session anchor asks where the day’s trading has occurred on average. An event anchor asks where trading since that event has occurred. Neither is universally superior, and averaging several visually attractive anchors does not create independent evidence. Specify the question before selecting the start time.
The event time and the knowledge time
Store event_at and available_at separately. A low that occurred on Monday but requires two subsequent daily bars for confirmation can only become an anchor on Wednesday after the close. At that point the line may be drawn from Monday, but no Monday trade may be simulated using Wednesday’s confirmation.
An anchor derived from news requires the publication timestamp actually available to the strategy. Revised files and labels assigned after the price move are not contemporaneous evidence. A freely dragged chart anchor is useful for exploration, but needs an explicit selection rule before it becomes an algorithm. TradingView’s drawing tool documents a user-selected starting point. [2]
Also define replacement and expiry. If a newer breakout appears, does it replace the old anchor, create a second independent candidate or leave the active trade untouched? Decide before testing. Replacing anchors whenever the current position looks uncomfortable can quietly widen risk and make the displayed historical support impossible to reproduce.
Cumulative calculation and frozen conditions
If price is USD per coin and volume is coin quantity, the weighted numerator is USD and the result returns to USD per coin. Replacing quantity with quote turnover changes the weighting. When cumulative volume is zero, return NA. The ATR buffers and conditions below are proposed experimental rules, not a complete reproduction of Shannon’s system.
Compute only from observations received by the decision time. Corrections arriving later require a documented point-in-time policy. Store the price type, anchor rule version, quantity unit and data cutoff so a chart and an execution engine can be reconciled. The sample trend condition is a filter; a separate price event is still required to enter.
For slope, calculate both the current value and the five-bar lag from the same selected anchor; do not reuse a stored value belonging to a different anchor. The lagged cumulative quantity must also be positive. Reconstructing that earlier segment after the anchor becomes known is valid for a current decision, but does not authorize a retrospective signal.
In the pseudocode, t and a are bar indices; start_bar_index is the first bar selected by the anchor rule, while available_at is a timestamp. For news released inside a bar, the OHLCV version starts with the first complete bar beginning at or after the event; a trade-based version can start at the exact event timestamp. Keep these conventions distinct.
anchor = first_confirmed_event(rule, data_asof=bar_close_time(t))
if anchor is None: return NO_SIGNAL
a, known_at = anchor.start_bar_index, anchor.available_at
if bar_close_time(t) < known_at: return NO_SIGNAL
pv = sum(((H[i]+L[i]+C[i])/3)*V[i] for i in a..t)
vol = sum(V[i] for i in a..t)
if vol <= 0: return INSUFFICIENT_DATA
avwap_now = pv / vol
trend_ok = False
if t >= a+5:
    past_vol = sum(V[i] for i in a..t-5)
    if past_vol > 0:
        past_pv = sum(((H[i]+L[i]+C[i])/3)*V[i] for i in a..t-5)
        avwap_lag = past_pv / past_vol
        trend_ok = C[t] > avwap_now and avwap_now > avwap_lag
# Both values use this same anchor; only emit a decision now.
# The trade trigger remains separate from this example filter.
A calculation by hand and two failure examples
Consider three synthetic trades: 10 units at 100, 20 units at 102 and 10 units at 99. VWAP is (1000 + 2040 + 990)/40 = 100.75. The unweighted average is approximately 100.333, while the last price is 99. These answer different questions. If the trades are aggregated into one bar with H=102, L=99 and C=99, HLC3 is 100, which differs from exact trade VWAP by 0.75.
A price of 101 above VWAP 100.75 does not establish a positive expected return for buying at 101. One failure path moves from 101 through 100.75 to 99 in a downtrend. Buying every touch simply creates repeated attempts to catch the decline. A second failure is selecting an anchor only after seeing that its future line fits several attractive bounces.
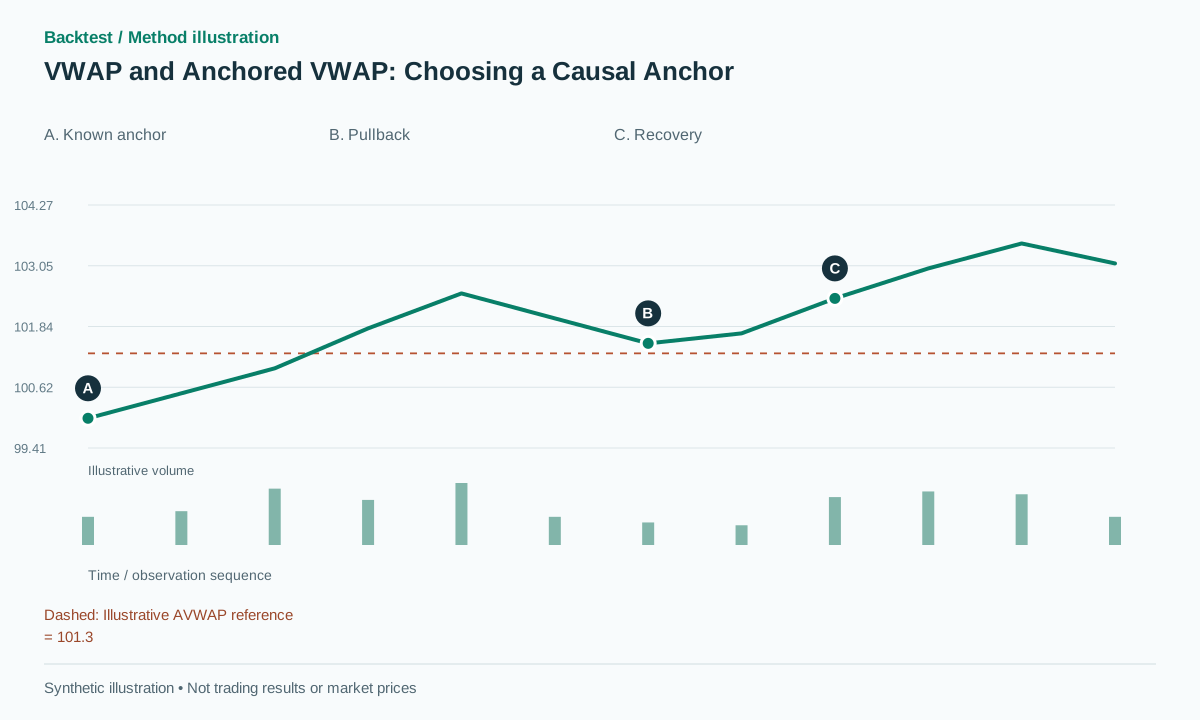
The chart uses a frozen illustrative reference level to show the sequence clearly. Actual AVWAP updates as new volume arrives. Do not import the drawn horizontal level as if it were a complete historical VWAP series; its role is to explain candidate location, pullback and subsequent recovery.
A pullback needs recovery and invalidation
One proposed long variant requires a qualifying trend state before the pullback. The first pullback enters AVWAP ±0.15 ATR; within the next three bars, a close must exceed the test bar’s high and finish above AVWAP. Freeze ATR when the candidate is formed. Place the stop below the pullback low minus a buffer, and enter at the next feasible event with spread and slippage.
Cancel the unfilled candidate if price closes below the allowed region before confirmation or the time limit expires. A strategy that demands every pullback bar remain above VWAP may reject the very temporary test it intended to study. Separate the pre-pullback trend state from the recovery condition.
For a crossover, compare yesterday’s close with yesterday’s VWAP and today’s close with today’s VWAP. Comparing both closes with today’s moving line changes the event definition. Once a position exists, keep the predetermined structural stop or a separately specified trailing rule. Do not move the anchor to justify a wider stop.
Mean-reversion targets also need an explicit convention. A VWAP target frozen at the event is different from a continuously moving VWAP target. In the latter case, specify whether an order is amended after each observation and account for the resulting execution timing. A line crossing a resting limit level after the fact is not proof that the order filled.
Add volume without counting the same information twice
VWAP already uses volume to weight price location. RVOL may still add information because it measures unusual participation relative to a baseline, but its incremental value must be measured. Test dry-up during the pullback and expansion during recovery separately before combining them.
For VWAP bands, specify whether variance uses trades or bar proxies, how volume enters the weights and when the estimate resets. A two-standard-deviation distance does not automatically imply a 95% probability of reversal or return to the mean. Trends, dependence and the distribution of observations invalidate that shortcut.
Two visually agreeing indicators are not two independent statistical observations. For example, price above a rising VWAP and price above a moving average can share much of the same information. Use controlled comparisons rather than an arbitrary score that rewards each correlated condition with another confidence point.
Test anchor rules, not the best-looking lines
Pre-register a small set of anchor rules, such as session start, confirmed breakout and confirmed pivot. On the same price candidates compare no VWAP, price location only, location plus slope and then an additional volume filter. Report the timeframe sensitivity of HLC3 estimates and the number of opportunities lost because an anchor became available late.
Perform a prefix-invariance check: calculate through a historical cutoff, append later observations and verify that previously emitted signals do not change. Changing the displayed historical path after a swing confirmation must not rewrite the signal log. Preserve anchor_rule_version, event_at, available_at, volume source and price_type.
Finally, replay the calculation under delayed data receipt and realistic execution. Report net expectancy, trade frequency, drawdown and rejected candidates. If performance depends on exact close fills or on picking a different anchor for each winning example, the useful result is an implementation warning rather than a deployable trading edge.
Common pitfalls
Choose the anchor from the outcome
Trying many anchors on the final test increases the chance of selecting a lucky visual fit.
Replace base volume with quote turnover
This changes the weighting and requires a different feature definition.
Fill at the close that just became known
An attractive result may depend on omitted spread and decision latency.
Checklist before using this method
Check each item after verifying it on your data. Progress is saved in this browser; it does not certify a profitable strategy.
Frequently asked questions
Is VWAP or AVWAP better?
The main distinction is the selected interval. Choose the anchor to answer a specific question and validate it on the intended data.
Can an old swing be the anchor?
Yes, but signals can only begin after the swing becomes confirmed. Redrawing a line into the past does not permit trading in the past.
Research sources
Each source supports the definition or evidence described beside it. The pseudocode, synthetic examples and proposed parameters require separate validation.
- Volume Weighted Average Price (VWAP)TradingView. Bar-based VWAP calculation and anchor/reset periods. Checked: .
- Anchored VWAP drawing toolTradingView. The tool’s user-selected starting point for anchored VWAP. Checked: .
- Specific Anchored VWAP StrategiesBrian Shannon / CMT Association. Public slides on anchors, slope and pullbacks; no claim to have read the entire paid book. Checked: .
Related methods
Risk note
This content supports education and research design, not financial advice. Backtest is historical simulation, does not guarantee future performance and does not place real trades. Methods in this library are not automatically features available in the app. See methodology and learning center.
Validate rules before risking real capital
Check app support, data and individual simulated trades; advanced detectors may require a separate implementation.
Download Backtest on the App Store