Article contents
Evidence and scope
The cited material supports terminology and research context. The numerical thresholds, state machine, execution policy and synthetic examples below are proposed by this research project. No new backtest has been run, and the references do not establish profitability for this configuration.
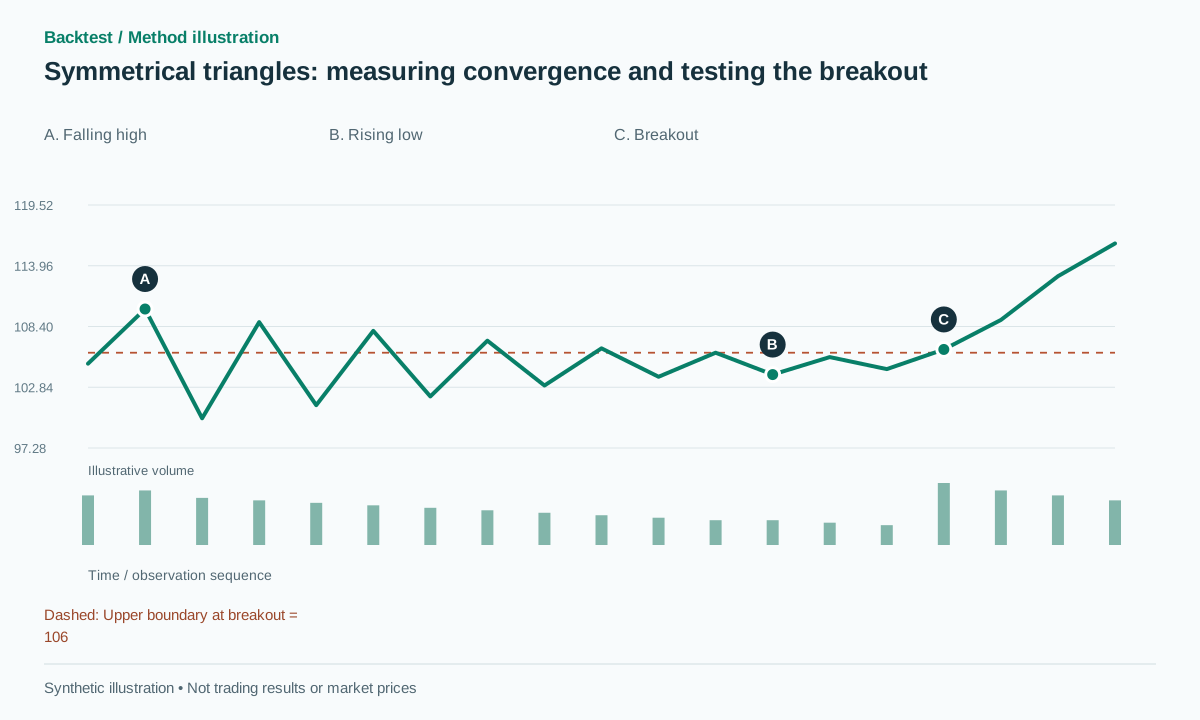 Open full-size illustration
Practical workflow
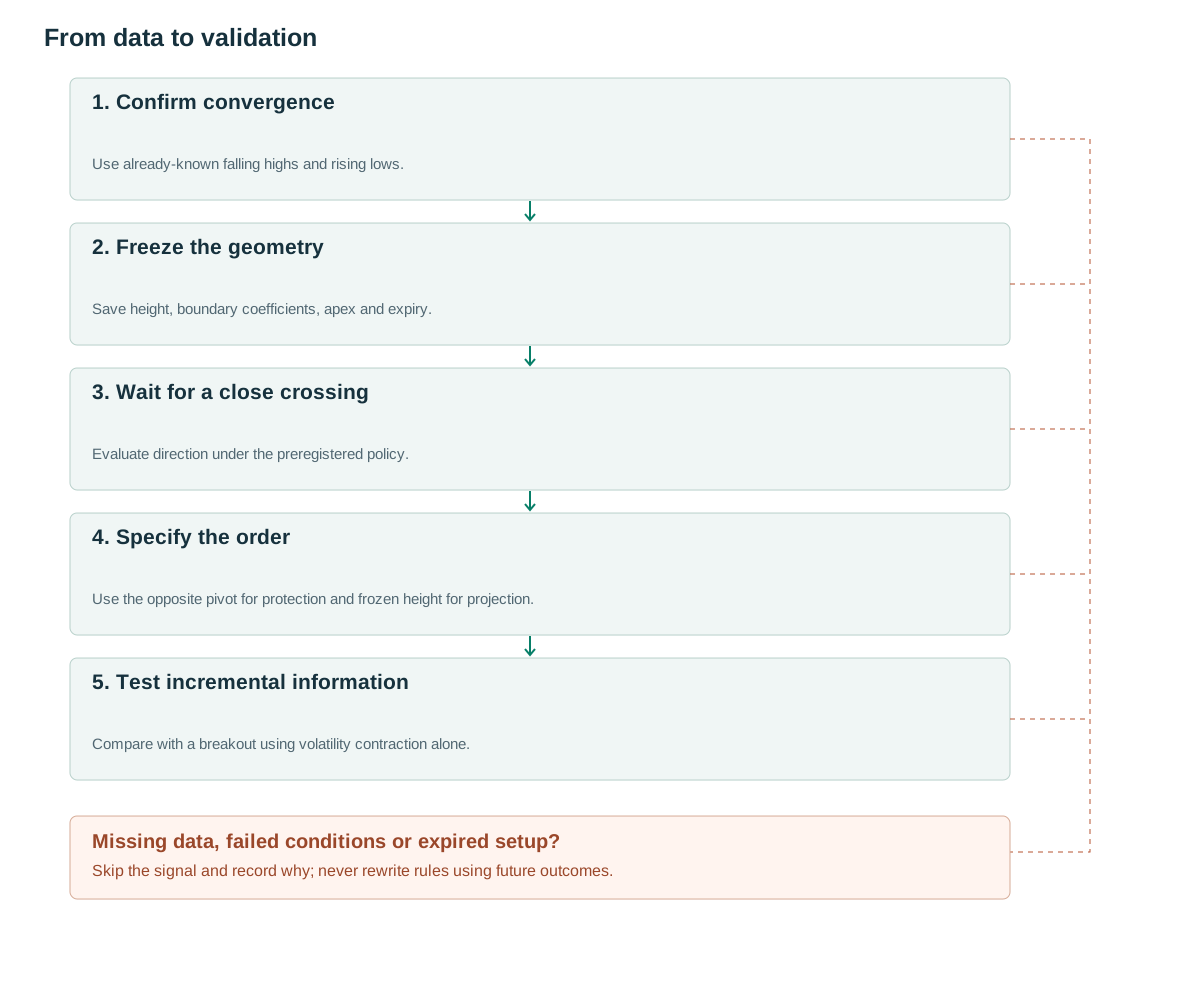
- Confirm convergenceUse already-known falling highs and rising lows.
- Freeze the geometrySave height, boundary coefficients, apex and expiry.
- Wait for a close crossingEvaluate direction under the preregistered policy.
- Specify the orderUse the opposite pivot for protection and frozen height for projection.
- Test incremental informationCompare with a breakout using volatility contraction alone.
What the structure tells us
Two converging sides distinguish a symmetrical triangle from a horizontal-sided triangle and from the short pennant structure considered elsewhere. [1] In numerical terms, both the upper and lower extremes move toward the middle, leaving a smaller final width than the initial width.
A shrinking range does not prove that volatility must expand immediately. The formation may extend, turn into a rectangle or lose its meaning when the projected lines intersect. A useful detector must be able to reject and expire candidates. A system that always finds a triangle somewhere in every noisy window provides little basis for a meaningful control experiment.
Separate geometric recognition from the directional hypothesis. A continuation-only strategy requires a prior-trend definition known before the pattern. A two-sided strategy instead accepts whichever valid crossing occurs first. Neither policy should be selected chart by chart after the eventual move is visible.
Rules using information already available
Proposed settings: confirm pivots with three bars on each side. Require at least five alternating pivots, with at least two touches on each boundary, within a pattern lasting 10–120 bars. Fit upper line U(t) and lower line B(t) from available anchors. Define D=max(U−B), A=ATR(14) at candidate creation, epsilon=max(2 ticks,0.15A) and b=max(2 ticks,0.10A).
Normalize slopes as sU=slope(U)T/D and sB=slope(B)T/D. Require sU<−0.25, sB>0.25, D≥1.5A and final-to-initial width between 0.2 and 0.7. Limit anchor residuals to max(2epsilon,0.1D). The upper line must remain above the lower line throughout the observed window. Also inspect large wick violations; a fitted line should not conceal substantial excursions outside the supposed boundaries.
Calculate the apex from the intersection of the two frozen lines. Expire before the apex and do not reconnect boundaries using future pivots. Pivot observations are published with a delay. [2] A one-sided continuation strategy and a strategy trading either break are different hypotheses that must be specified before testing.
The first valid signal consumes the candidate in this baseline. This prevents a sequence of alternating breaks around the same narrowing region from being treated as unlimited independent opportunities. A re-entry version is possible, but it needs a reset condition, a new risk budget and a separate results label.
when all anchors are known:
  fit fixed U,B; validate slopes, width and residuals
  expiry=min(apex-1, created+max(5,ceil(T/2)))
for closed t in (created,expiry]:
  up = C[t-1] <= U(t-1)+b and C[t] > U(t)+b
  down = C[t-1] >= B(t-1)-b and C[t] < B(t)-b
  if up: emit LONG, stop=last_confirmed_low-epsilon
  if down: emit SHORT, stop=last_confirmed_high+epsilon
  consume candidate after first signal
Giving volume a specific job
One proposed activity-contraction feature is median volume in the second half divided by median volume in the first half, with a trial threshold below 0.8. Breakout RVOL uses the preceding 20 bars, or matching time slots in earlier sessions. These measures answer different questions: whether activity decreased within the base, and whether the break itself was unusually active.
Do not include the breakout bar in a historical denominator when the declared definition excludes it. Preserve the price-only version as a control. A volume filter may remove strong gap moves and leave trades with easier execution; in that case, investigate the contribution of fill economics rather than attributing the entire change to information in volume.
Save the two ratios separately. If only their combined pass/fail flag is retained, it becomes difficult to see whether one condition contributes nothing while the other does all the selection. Missing volume should not be converted to zero and interpreted as exceptional contraction.
Numerical examples and failure cases
Synthetic example: over 30 bars U falls from 110 to 106 while B rises from 100 to 104. D=10, sU=−0.4, sB=0.4 and the final width ratio is 2/10=0.2. After the candidate is confirmed, a close at 106.3 crosses above an upper-line value of 106 with b=0.1. A feasible entry at 106.4, stop at 103.85 and target at 116 imply risk of 2.55 and projected reward of 9.6, about 3.76R before costs. The target is a projection rather than realized profit.
Failure example: price closes beyond the threshold, then returns inside the formation and reaches the 103.85 stop. The trade remains a loss; it cannot be discarded because the break lacked a retest. Another candidate may reach its apex without a sufficient crossing. It expires, rather than having its lines extended until a favorable outcome appears.
An implementation boundary test sets final width to zero while leaving the other measurements unchanged. That case must fail because the bounded region has disappeared. A second test keeps width positive but places the last anchor’s confirmation after expiry; it should also produce no tradable candidate, despite an attractive retrospective outline.
Entry, invalidation and exits
The close-confirmed version enters at the next feasible event and places protection beyond the last confirmed opposite pivot. Project the largest observed height D from the boundary value at breakout. A pivot that becomes confirmed after entry cannot be used to improve the initial stop retrospectively.
A later trailing stop may use newly confirmed pivots, but its update schedule must be causal. Keep the original risk definition for reporting R multiples, even if the protective level subsequently moves. A geometric target, fixed 2R exit and pivot trail are separate exit experiments on the same entry set.
Near the narrow end of a triangle, spread and slippage can consume a substantial fraction of a short stop distance. Apply minimum stop-distance, tick-size, liquidity and notional constraints. If a bar could imply multiple execution events and OHLC cannot determine their order, use finer data or a conservative convention fixed in advance.
Testing incremental value
Compare the triangle with a strategy that requires only falling ATR followed by a rolling-window breakout. This tests whether the converging geometry contributes information beyond generic volatility contraction. Examine prior trend, breakout location and unequal side slopes, with subgroup definitions fixed before the final test.
Do not infer a 50/50 directional probability merely because the pattern is called symmetrical. Nor should a visually balanced triangle be assumed statistically superior to an uneven one. These are testable claims that need enough independent opportunities and uncertainty estimates.
Report detection frequency, expiration rate, fills, net returns and drawdown. The methodological reference [3] does not validate the proposed parameters. Deduplicate overlapping windows so that one formation does not become dozens of apparently independent observations. Replay tests should verify stable historical lines, unchanged signals after appending future data and correct old-close comparisons against U(t−1) or B(t−1).
Common pitfalls
Confusing symmetry with identical slopes
The name does not require equal slope magnitudes. Use measurable tolerances rather than visual perfection.
Merging pennants indiscriminately
A short base after a strong pole has different context and should retain a separate label.
Searching many windows for one attractive result
Testing every duration and retaining winners creates selection bias. Declare the window set beforehand.
Checklist before using this method
Check each item after verifying it on your data. Progress is saved in this browser; it does not certify a profitable strategy.
Frequently asked questions
Should entry wait for a retest?
That can be tested separately, including missed trades and changed entry prices. A retest is not compulsory in this close-breakout baseline.
Is an opposite-trend break an invalid triangle?
No. The geometry may remain valid while the continuation hypothesis fails. Keep those labels distinct.
Research sources
Each source supports the definition or evidence described beside it. The pseudocode, synthetic examples and proposed parameters require separate validation.
- IG: A guide on triangle patterns for tradersIG. Triangle terminology and converging-boundary geometry; the relevant public material was read. Checked: .
- TradingView: RepaintingTradingView. Pivot confirmation delay and repainting. Checked: .
- Lo, Mamaysky, Wang: Foundations of Technical AnalysisNBER / Columbia University. Background on systematic pattern research; this configuration is not tested by the paper. Checked: .
Related methods
Risk note
This content supports education and research design, not financial advice. Backtest is historical simulation, does not guarantee future performance and does not place real trades. Methods in this library are not automatically features available in the app. See methodology and learning center.
Validate rules before risking real capital
Check app support, data and individual simulated trades; advanced detectors may require a separate implementation.
Download Backtest on the App Store