Article contents
Evidence and scope
The cited material supports terminology and research context. The numerical thresholds, state machine, execution policy and synthetic examples below are proposed by this research project. No new backtest has been run, and the references do not establish profitability for this configuration.
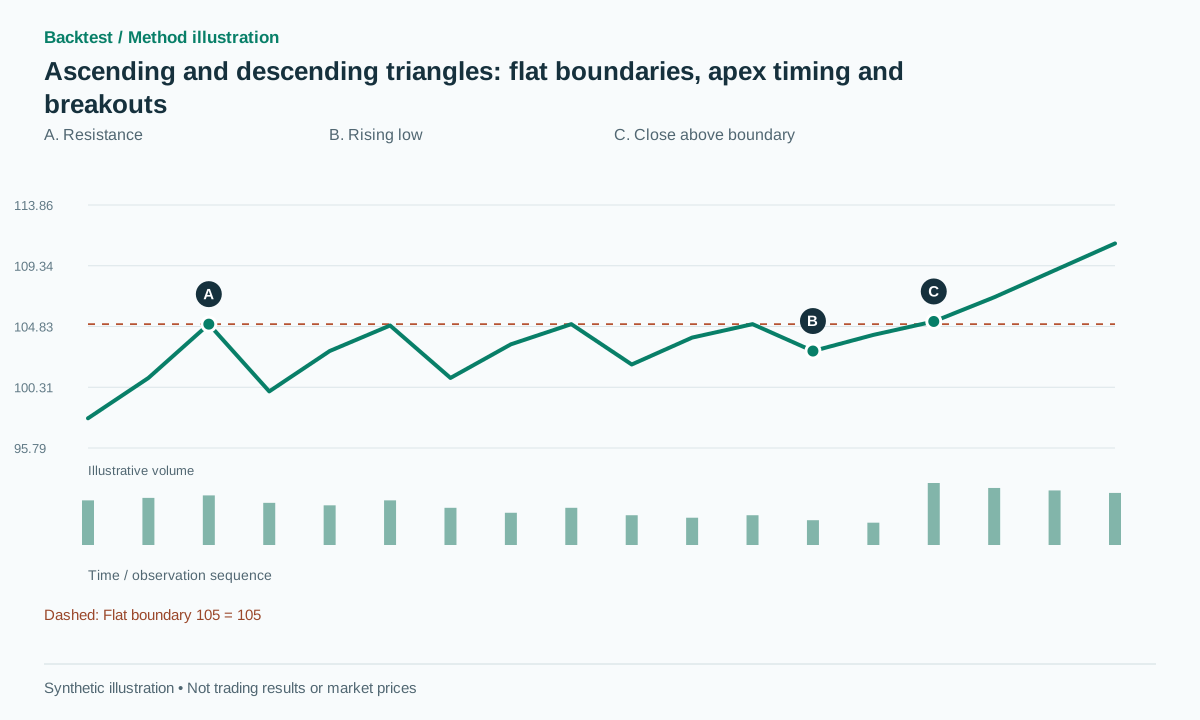 Open full-size illustration
Practical workflow
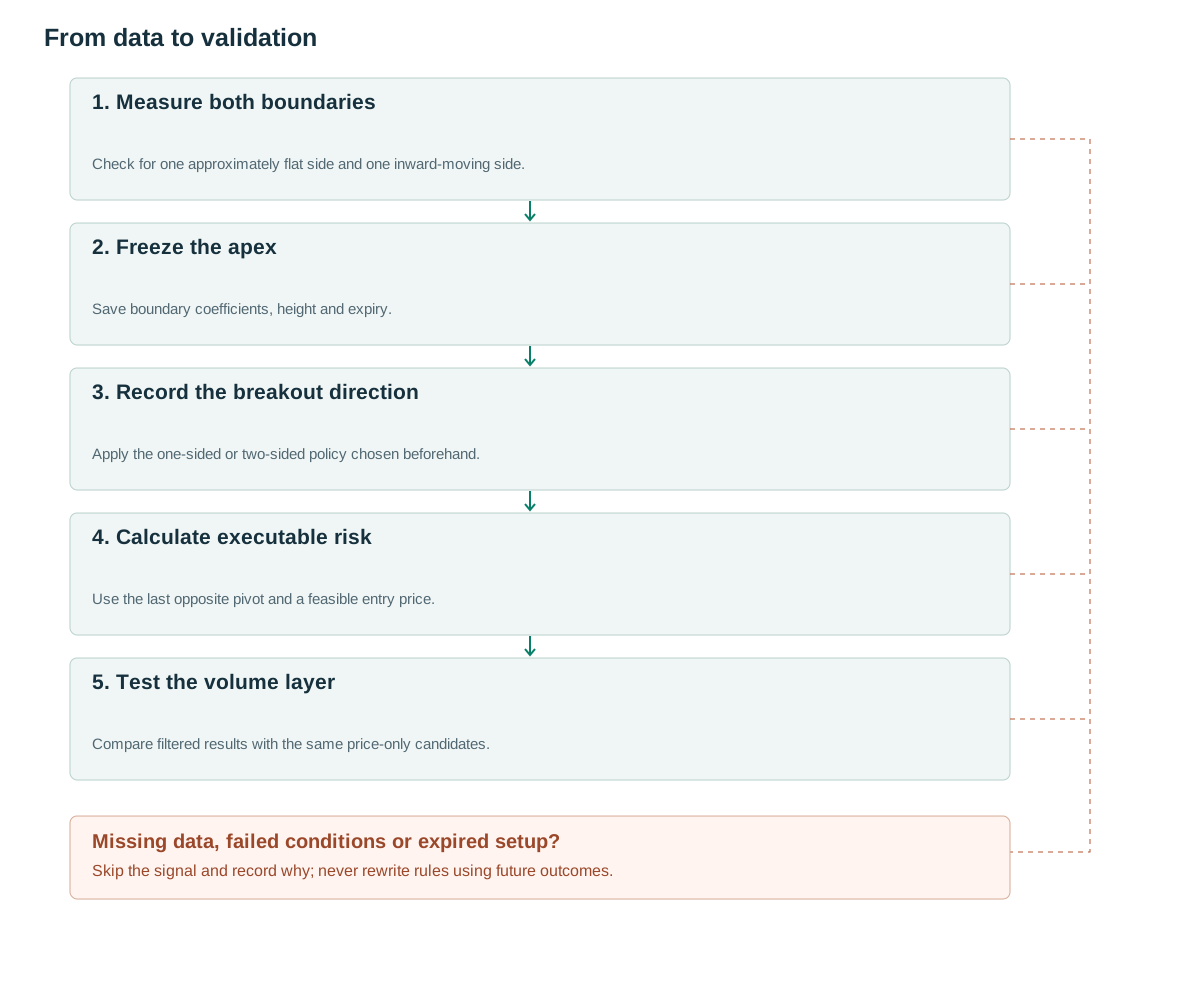
- Measure both boundariesCheck for one approximately flat side and one inward-moving side.
- Freeze the apexSave boundary coefficients, height and expiry.
- Record the breakout directionApply the one-sided or two-sided policy chosen beforehand.
- Calculate executable riskUse the last opposite pivot and a feasible entry price.
- Test the volume layerCompare filtered results with the same price-only candidates.
What the structure tells us
IG describes the ascending form through near-horizontal highs and rising lows, with the descending form as its mirror. [1] The flat side identifies a repeatedly tested level, while the other side moves inward and reduces the available trading range.
The interpretation that buyers are pressing sellers can be useful as a hypothesis, but a chart does not reveal hidden resting orders. Price can break through the sloping side instead. A system must retain that outcome as either an opposite-direction signal or a failed continuation candidate, according to its policy, rather than removing it from the dataset.
There are therefore two distinct research choices. One strategy trades only the direction implied by the conventional name. Another trades the first valid break in either direction. They share a detector but not the same opportunity set. Comparing their results requires keeping the original candidates, including the breaks that the one-sided version declines to trade.
Rules using information already available
All following numerical settings are proposed research parameters. Use pivots confirmed with three bars on each side. Require at least five alternating pivots, with at least two on each boundary. Once the final anchor becomes available, fit an upper line U(t) and lower line B(t). Use only confirmed anchors. Limit each anchor error to max(0.3A,0.1D), where A=ATR(14) and D is the maximum U−B width over the observed pattern.
Let T be the pattern duration. Normalize slopes as sU=slope(U)×T/D and sB=slope(B)×T/D. An ascending triangle requires |sU|≤0.25 and sB>0.25. A descending triangle requires |sB|≤0.25 and sU<−0.25. Require the final-to-initial width ratio to lie between 0.2 and 0.7, with both widths positive.
Calculate the apex from the intersection U=B using the frozen line coefficients. Only seek a breakout after candidate creation and before that intersection. A proposed expiry is the earlier of 90% of the interval from pattern start to apex and half a pattern duration after creation, with a minimum five-bar allowance for the latter limit. Round time boundaries consistently to the bar grid.
A candidate whose apex is already too close when its last pivot becomes confirmed has no valid trading window. That is a legitimate consequence of a delayed detector. [2] Do not move its creation time backward to make the breakout tradable, or refit the lines with future pivots to extend the expiry.
at confirmed final pivot:
  fit U(t),B(t); compute T,D,sU,sB,width_ratio,apex
  if geometry_valid and created < expiry: freeze candidate
for t > created:
  if t >= expiry: expire
  elif C[t-1] <= U(t-1)+b and C[t] > U(t)+b: signal LONG; consume candidate
  elif C[t-1] >= B(t-1)-b and C[t] < B(t)-b: signal SHORT; consume candidate
# b=max(2 ticks,0.10A). Trading only the named direction is a separate variant.
Giving volume a specific job
Reduced volume late in the formation followed by increased activity at breakout is a hypothesis that can be measured directly. For example, test whether median volume in the final third is below median volume in the first third, then require breakout RVOL≥1.5. These cutoffs are proposed settings, not rules established by the cited author.
For intraday data, compare matching session slots or otherwise adjust for normal time-of-day activity. A quiet midday bar is not automatically evidence that available supply has been exhausted. Compare a price-only strategy, a breakout-volume filter and the complete contraction-plus-expansion filter.
Report flat-side breaks separately from sloping-side breaks. Their stop distances and recent price paths can differ materially. A volume filter that improves only one side should not be described as confirming the triangle equally well in every direction.
Numerical examples and failure cases
Synthetic ascending-triangle example: U=105 while B rises from 99 to 103 over 30 bars. D=6, sU=0, sB=0.667 and the width ratio is 2/6=0.333, satisfying the proposed geometry. At a breakout-line value of 105, with A=1 and b=0.1, a close at 105.2 confirms a long. A feasible entry at 105.3, stop below the last low at 102.85 and target at 111 give risk of 2.45 and projected reward of 5.7, or about 2.33R before costs.
Failed-continuation example: before breaking 105, price closes at 102.7 below the lower line when that line is at 103. A long-only ascending-triangle strategy cancels its candidate. A two-sided strategy may issue a short under its separate execution rules. A different failure occurs after a long fills at 105.3 and later reaches 102.85: record the stopped trade even if the market subsequently resumes rising.
A practical boundary case is a pattern accepted geometrically but confirmed after the expiry threshold. The correct result is no active candidate. This helps distinguish an attractive retrospective shape from a formation that the proposed algorithm could actually recognize and trade in time.
Entry, invalidation and exits
Place the protective stop outside the last confirmed pivot on the opposite side, using epsilon=max(2 ticks,0.15A). The projected long target is the breakout boundary value plus D; the short target is the breakout boundary value minus D. Freeze the target at signal time. A fixed 2R exit is an alternative experiment rather than an interchangeable replacement.
The apex is a limit of the extrapolated geometry, not a scheduled market event. Do not place a trade merely because the lines are about to intersect. If using a resting intrabar breakout order instead of close confirmation, build a separate fill model. An order already triggered through a gap cannot be deleted after the gap becomes visible.
Before submission, check that the available fill leaves the stop on the correct side and sufficient reward after costs. A tight final range can create apparently large R multiples while making spread and slippage a substantial fraction of the stop distance. Apply position-size and liquidity limits rather than assuming unlimited size at the chart price.
Testing incremental value
Use a rolling-high/low breakout with the same duration and exit policy as the control. This tests whether requiring a flat boundary adds value beyond generic compression. Stratify by breakout position relative to the apex, slope of the moving side and prior trend, with groups declared before reviewing the final test set.
Retain expired candidates and opposite-direction breaks. Report coverage, net expectancy, drawdown and sensitivity around the 0.25 normalized-slope cutoff. Profitability appearing only at one very narrow setting is a warning that the configuration may be overfit. No new backtest has established an edge for the proposed rules.
Implementation tests should include nearly flat lines on both sides, a true ascending triangle, a converging pattern with no flat side, crossed boundaries, and an anchor outlier hidden by the line fit. Verify that old and new closes are compared with boundary values at their own timestamps. A replay test should show identical historical candidates when new data are appended.
Common pitfalls
Forcing a horizontal line
Connecting only convenient highs can hide substantial boundary violations elsewhere.
Accepting a break after the apex
Once the lines have crossed, the original bounded formation no longer exists under this definition.
Discarding the opposite break
Removing failures through the sloping side inflates the apparent success of the named direction.
Checklist before using this method
Check each item after verifying it on your data. Progress is saved in this browser; it does not certify a profitable strategy.
Frequently asked questions
Must an ascending triangle break upward?
No. Its name describes geometry. Trade direction requires confirmation or an explicitly one-sided research hypothesis.
Should boundaries use wicks or closes?
Either can be researched, but anchor construction and trigger definitions must be consistent. This version uses high/low pivots and close-based confirmation.
Research sources
Each source supports the definition or evidence described beside it. The pseudocode, synthetic examples and proposed parameters require separate validation.
- IG Academy: Basic chart patterns part twoIG. Basic ascending and descending triangle geometry; the relevant public section was read. Checked: .
- TradingView: RepaintingTradingView. Pivot confirmation delay and repainting. Checked: .
- Lo, Mamaysky, Wang: Foundations of Technical AnalysisNBER / Columbia University. Background on systematic pattern research; this configuration is not tested by the paper. Checked: .
Related methods
Risk note
This content supports education and research design, not financial advice. Backtest is historical simulation, does not guarantee future performance and does not place real trades. Methods in this library are not automatically features available in the app. See methodology and learning center.
Validate rules before risking real capital
Check app support, data and individual simulated trades; advanced detectors may require a separate implementation.
Download Backtest on the App Store