Article contents
Evidence and scope
The cited material supports terminology and research context. The numerical thresholds, state machine, execution policy and synthetic examples below are proposed by this research project. No new backtest has been run, and the references do not establish profitability for this configuration.
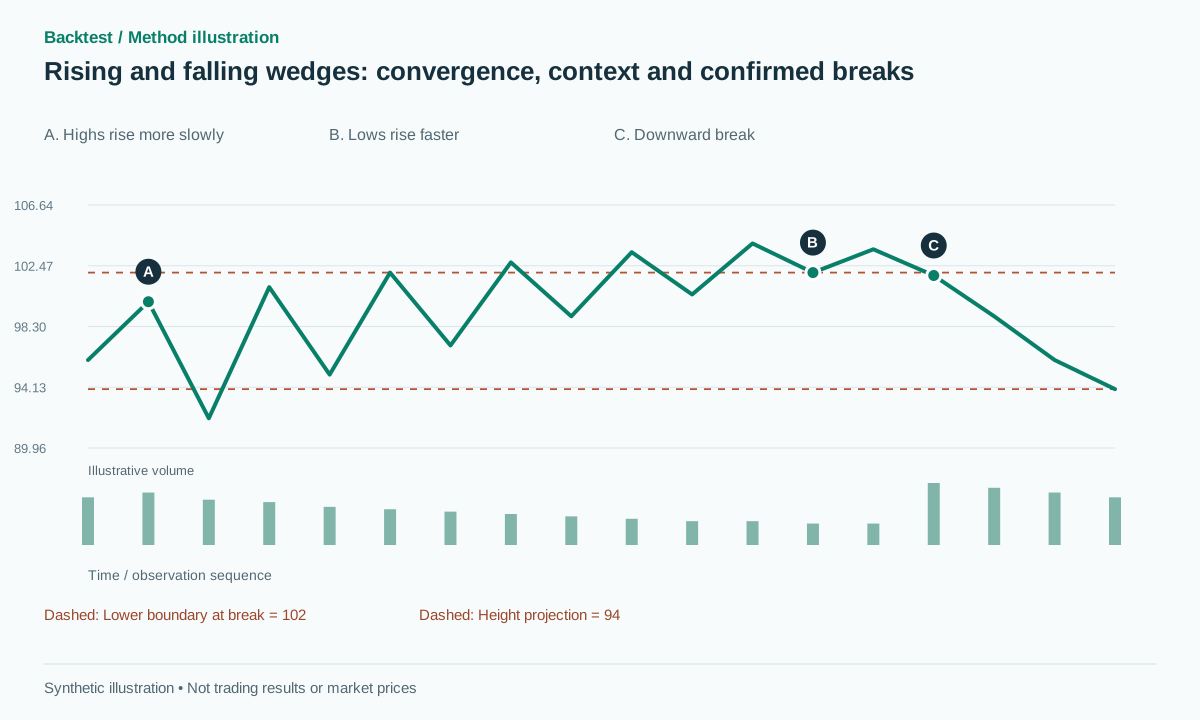 Open full-size illustration
Practical workflow
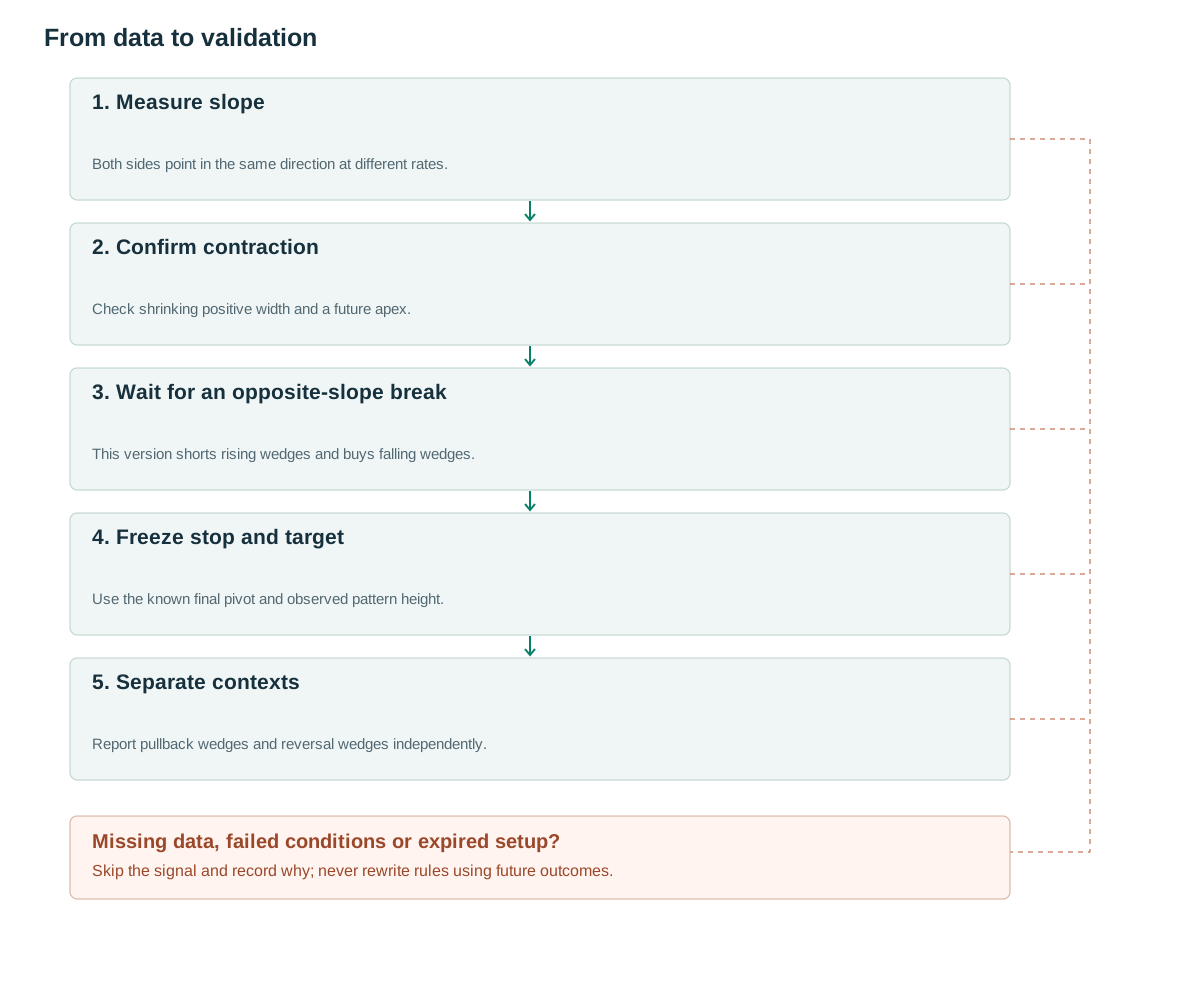
- Measure slopeBoth sides point in the same direction at different rates.
- Confirm contractionCheck shrinking positive width and a future apex.
- Wait for an opposite-slope breakThis version shorts rising wedges and buys falling wedges.
- Freeze stop and targetUse the known final pivot and observed pattern height.
- Separate contextsReport pullback wedges and reversal wedges independently.
What the structure tells us
A wedge differs from a symmetrical triangle because both sides slope in the same direction, and from a channel because its width contracts. [1] In a rising wedge, lows rise faster than highs. In a falling wedge, highs decline faster than lows.
The same geometry can appear as a pullback within a larger trend or near the end of an extended move. In the first context, its break may support continuation; in the second, it may be interpreted as reversal. Store the preceding context using information available before the pattern. Naming a winning outcome continuation only after it occurs introduces selection bias.
A wedge detector is therefore a combination of geometry, timing and a declared trading direction. The proposed baseline does not sell every rising sequence or buy every falling sequence. It first requires meaningful convergence, then waits for a close through the boundary opposite the direction of the wedge’s slope.
Rules using information already available
Proposed settings: use pivots confirmed with three bars on each side, with at least five alternating pivots and two points on each boundary. At candidate creation freeze A=ATR(14), epsilon=max(2 ticks,0.15A) and b=max(2 ticks,0.10A). Fit upper line U(t) and lower line B(t). Define D=max(U−B), T=pattern duration, sU=slope(U)T/D and sB=slope(B)T/D.
A rising wedge requires sB>sU>0.25. A falling wedge requires sU<sB<−0.25. Require final-to-initial width between 0.2 and 0.7, D≥1.5A and anchor residuals no greater than max(2epsilon,0.1D). U must remain above B across the observed window, and the projected intersection must lie after candidate creation.
If the sides are nearly parallel, classify the structure with the channel detector rather than relaxing the wedge definition. This baseline trades a rising wedge only on a downward crossing and a falling wedge only on an upward crossing. A break in the slope direction is recorded as failure of this particular directional hypothesis, not erased from the candidate record.
Expire at the earlier of apex−1 and created+max(5,ceil(T/2)), expressed on a consistent bar grid. Pivots become available after their confirmation delay. [2] Freeze the lines and do not incorporate a later extreme to redraw a wedge around a previously failed break.
after final anchor confirmation:
  fit U,B and freeze parameters
  mode = SHORT if rising_wedge else LONG if falling_wedge else NONE
for later closed bar t before expiry:
  if mode==SHORT and C[t-1]>=B(t-1)-b and C[t]<B(t)-b:
    signal; stop=last_high+epsilon; target=B(t)-D
  elif mode==LONG and C[t-1]<=U(t-1)+b and C[t]>U(t)+b:
    signal; stop=last_low-epsilon; target=U(t)+D
  elif breakout_in_other_direction: cancel
Giving volume a specific job
A possible volume experiment requires lower median activity in the second half than the first, together with breakout RVOL≥1.5. In a falling wedge, a high-volume bar near the low does not prove that liquidation has ended; the boundary-break requirement remains unchanged. In a rising wedge, quiet volume may reflect a normal session lull or thin liquidity.
Keep price features and volume features in separate groups. When removing a volume filter for a control experiment, leave the other rules unchanged. Intraday data require time-of-day normalization; exchange-aggregated data need a consistent source and unit throughout the sample.
It is also useful to examine rejected opposite-direction breaks. If those breaks systematically have larger activity than accepted breaks, the volume rule may be interacting with the directional policy. That is a reason to analyze the interaction, not to redefine the wedge after reviewing which subset performs best.
Numerical examples and failure cases
Synthetic rising wedge: over 30 bars U rises from 100 to 104 while B rises from 92 to 102. D=8, sU=0.5 and sB=1.25. The width ratio is 2/8=0.25. With A=1 and b=0.1, a close at 101.8 crosses below a lower-boundary value of 102. A feasible short at 101.7, stop at 104.15 and target at 94 imply risk of 2.45 and projected reward of 7.7, approximately 3.14R before costs.
Failed-hypothesis example: price first breaks the upper line at 104.5. The short-only rising-wedge version cancels the candidate. A trading failure instead occurs after a valid short at 101.7 rebounds to 104.2 and reaches the stop. Once the trigger has been satisfied, it is not legitimate to rename the event an unconfirmed break because it later loses.
The falling-wedge calculation mirrors the inequalities and trade direction. However, the economic result need not be symmetrical: stock short availability, borrow charges and upside gaps differ from long-side execution. Maintain separate outcome statistics before deciding whether pooling the two forms is justified.
Entry, invalidation and exits
Place the stop beyond the final confirmed opposite pivot. The baseline does not automatically use the most distant extreme of the entire pattern, although that is another possible stop version. Project D from the boundary at the signal and freeze the target. A return to the beginning of the wedge is a different objective and should not be substituted retrospectively.
Enter after close confirmation and check the available quote and spread before submitting a new order. A protective stop can fill beyond its intended level through a gap. For short equities, verify borrow availability and include borrow costs; a theoretical signal is not automatically an executable short.
The distinction between structural invalidation and trade protection should be explicit. A tight last-pivot stop may be reached while the larger wedge outline still appears intact. That does not authorize moving the stop farther away. If the research policy instead exits on a close back inside the wedge, test that rule separately because its timing and gap exposure differ from a resting stop.
Testing incremental value
Use a break of a same-direction channel without contraction as a control. This isolates whether the converging shape contributes information. Split results between wedges inside a pullback and wedges following an extended trend, with a context definition known before the pattern, such as confirmed higher-high/higher-low structure or a fixed moving-average slope.
Test sensitivity to minimum slope and the width-contraction range while reporting how many opportunities disappear. Results dominated by a few large reversals need to be identified. No new out-of-sample result is available for this configuration; [3] is a methodological reference rather than evidence for these settings.
Useful implementation checks include parallel rising boundaries, converging rising boundaries with insufficient slope, negative widths, an apex before confirmation and a break during the right-pivot delay. Verify that the old close is evaluated against the old boundary value. For mirror tests, transform high and low correctly: negating prices requires the new high to equal minus the old low, not minus the old high.
Common pitfalls
Confusing a channel with a wedge
Nearly parallel sides form a channel; do not rename them merely to predict reversal.
Selling every rising wedge candidate
Price can continue rising or break upward. Geometry alone does not trigger this strategy.
Using a future extreme for the stop
A high confirmed after breakout cannot improve the initial risk calculation retrospectively.
Checklist before using this method
Check each item after verifying it on your data. Progress is saved in this browser; it does not certify a profitable strategy.
Frequently asked questions
Is every falling wedge a buy signal?
No. This version waits for a close through the upper boundary. An unconfirmed candidate may continue falling.
How many touches are required?
Two on each side and five in total are the proposed starting settings. Three per side is stricter but increases delay and reduces coverage.
Research sources
Each source supports the definition or evidence described beside it. The pseudocode, synthetic examples and proposed parameters require separate validation.
- IG: Falling and rising wedge chart patternsIG. Wedge terminology and geometry; the relevant public material was read. Checked: .
- TradingView: RepaintingTradingView. Pivot confirmation delay and repainting. Checked: .
- Lo, Mamaysky, Wang: Foundations of Technical AnalysisNBER / Columbia University. Background on systematic pattern research; this configuration is not tested by the paper. Checked: .
Related methods
Risk note
This content supports education and research design, not financial advice. Backtest is historical simulation, does not guarantee future performance and does not place real trades. Methods in this library are not automatically features available in the app. See methodology and learning center.
Validate rules before risking real capital
Check app support, data and individual simulated trades; advanced detectors may require a separate implementation.
Download Backtest on the App Store