Article contents
- Evidence and scope
- Illustration
- Process
- What the volume-weighted reference measures
- Specify the first trade, equality and each reversal
- Costs determine whether a low-win-rate system survives
- Account notional and the ETF's internal leverage
- Synthetic trend capture and repeated whipsaw
- A validation plan that tests the fragile assumptions
- Common pitfalls
- Practical checklist
- Frequently asked questions
- Research sources
Evidence and scope
The authors report QQQ +671%, Sharpe 2.1 and 9.4% maximum drawdown, and TQQQ +8,242%, Sharpe 1.7 and 36.1% maximum drawdown for 2 January 2018–28 September 2023. Their model assumes $0.0005 commission per share and zero slippage. These are reported backtests, not verified live results. [1]
 Open full-size illustration
Practical workflow
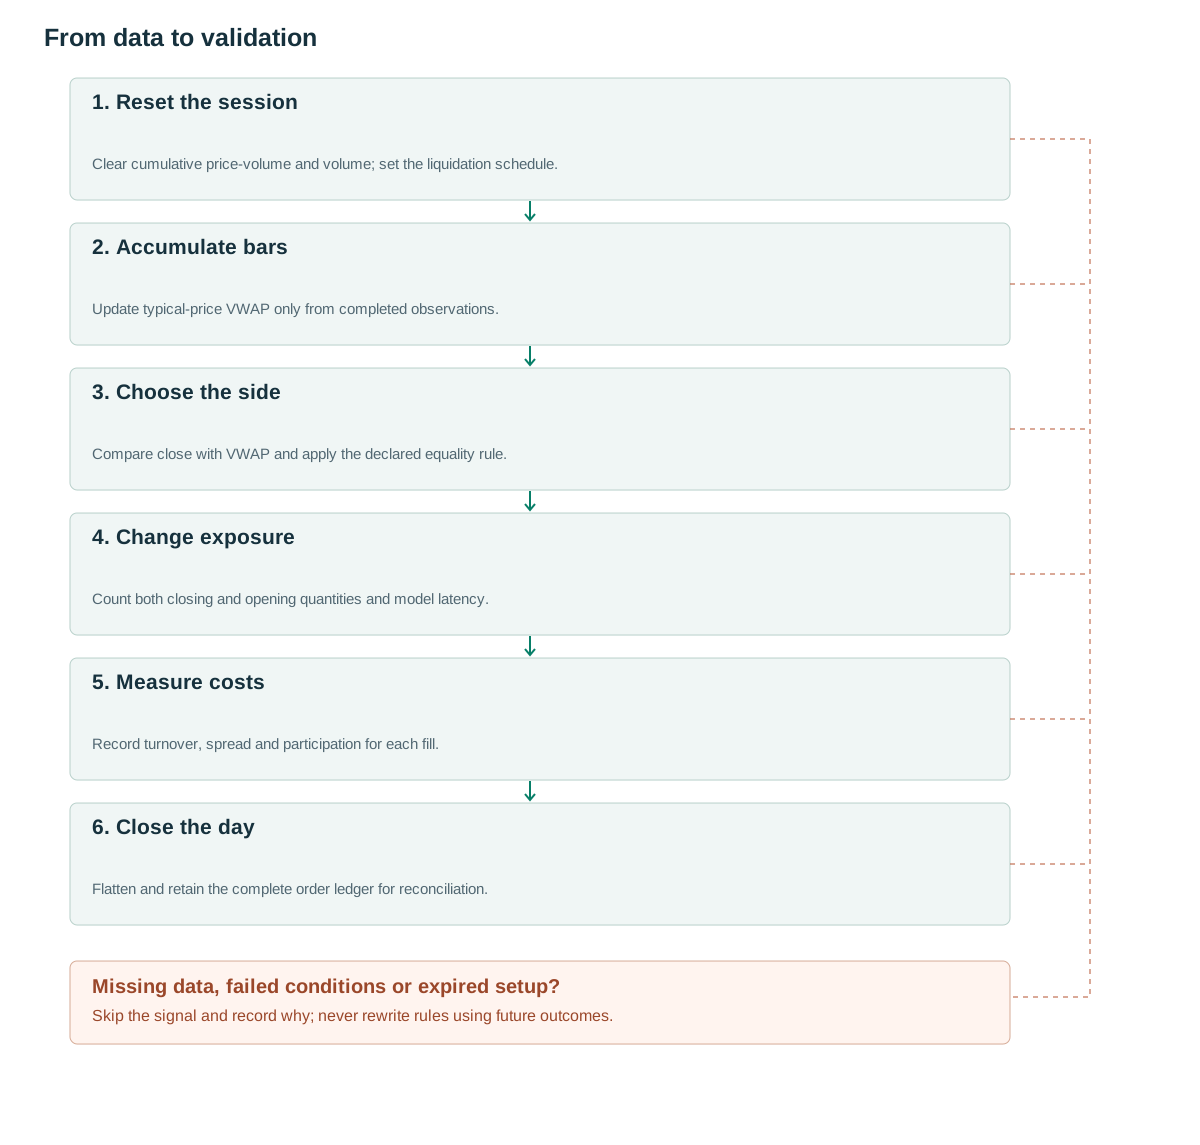
- Reset the sessionClear cumulative price-volume and volume; set the liquidation schedule.
- Accumulate barsUpdate typical-price VWAP only from completed observations.
- Choose the sideCompare close with VWAP and apply the declared equality rule.
- Change exposureCount both closing and opening quantities and model latency.
- Measure costsRecord turnover, spread and participation for each fill.
- Close the dayFlatten and retain the complete order ledger for reconciliation.
What the volume-weighted reference measures
Session VWAP is cumulative price multiplied by volume, divided by cumulative volume. At transaction resolution it weights each transaction price. A bar approximation instead selects a representative bar price, commonly (H+L+C)/3, then weights it by the bar's volume. These definitions can diverge when trading is concentrated at particular prices within a wide bar.
Consider two synthetic observations at prices 100 and 102 with volumes 100 and 300. Their VWAP is (100×100+102×300)/400=101.50. The unweighted mean is 101.00. The difference reflects where more shares changed hands; it does not establish that the higher-volume participants were informed or that price must return to their average.
The session reset is part of the definition. An anchored VWAP starting several days earlier is a different reference. TradingView's documentation describes the calculation and anchoring choices, but an indicator definition is not evidence that a crossing rule earns a profit. [3]
The continuation hypothesis is that remaining on one side of VWAP can identify an intraday directional move. A market oscillating around its cumulative average produces the opposite environment: many directional changes without enough travel to pay the repeated trading costs.
Specify the first trade, equality and each reversal
The research rule trades after the first completed minute: above VWAP means long, below means short, crossings reverse the position and the strategy is flat at the end of the day. It uses account-sized notional without an additional account-level borrowing multiplier. [1] TQQQ still contains leverage internally, which must be analyzed separately.
The pseudocode is a proposed causal implementation. It accumulates only completed bars, retains the previous side on exact equality and submits a target after the signal becomes available. Equality handling is an explicit implementation convention. Substituting a different convention is acceptable only if recorded as another tested rule.
An unchanged target should not generate another entry. A change from +100 shares to −100 shares requires selling 200 shares: 100 closes the long and 100 opens the short. A simulator that charges a single 100-share action understates reversal turnover.
Order processing also needs a policy for outstanding orders. If an earlier target is not fully filled when a new signal arrives, reconcile the real position and pending quantity before submitting the next target. Simulating instant complete fills can conceal this problem during fast reversals.
At the session liquidation deadline, cancellation and flattening must override fresh signal generation. The code sketch expresses the core logic; its event scheduler must enforce that priority, including shortened exchange sessions.
on_session_start():
    cum_pv = 0; cum_volume = 0
    target_side = 0
on_completed_minute(bar):
    typical = (bar.high + bar.low + bar.close) / 3
    cum_pv += typical * bar.volume
    cum_volume += bar.volume
    if cum_volume <= 0: return
    vwap = cum_pv / cum_volume
    new_side = sign(bar.close - vwap)
    if new_side == 0: new_side = target_side
    if new_side != target_side:
        target_side = new_side
        submit_target_after_signal(target_side, budget=available_equity)
on_session_liquidation_deadline():
    cancel_pending_orders()
    submit_flat()
Costs determine whether a low-win-rate system survives
The source reports 21,967 QQQ trades with a 17.0% trade win rate and 22,399 TQQQ trades with a 17.2% trade win rate. [1] Such a strategy depends on the size of winners relative to losers, not on winning most of the time. The low hit rate also makes turnover and the handling of short losing sequences central to evaluation.
In a synthetic example, buying 100 shares at 100.02 and selling at 100.22 earns $20 gross. Suppose round-trip commission is $0.70 and additional spread/slippage cost is $3.00; net profit is $16.30. Twelve similar round trips incur $44.40 in those costs even before asking whether their price gains are positive.
For a stylized trade distribution with win probability 0.20, average winner 5R and average loser 1R, gross expectancy is 0.20×5−0.80×1=0.20R. Average cost of 0.10R leaves 0.10R; cost of 0.25R makes expectancy −0.05R. These are illustrations, not estimates of the paper's distribution.
Do not add spread twice. If a simulator already buys at the ask and sells at the bid, that spread is embedded in fill prices. Add only costs not already represented. Conversely, a close-to-close model has not paid the spread simply because a commission line appears in its report.
Evaluate costs by time of day, spread, volatility and participation rate. A constant tiny cost assumption can be particularly fragile near the open, around news and when the strategy repeatedly crosses its reference.
Account notional and the ETF's internal leverage
TQQQ's objective is three times the daily performance of the Nasdaq-100 before fees and expenses. Its issuer explains that longer holding-period performance can differ materially from three times the index's cumulative change. [2] Using all account equity to purchase TQQQ therefore does not mean the economic exposure is unleveraged.
A synthetic two-day path shows the compounding effect. An index rises 10% and then falls 9.0909%, returning approximately to its start. An idealized daily three-times product moves from 100 to 130, then to about 94.545. The product loses value even though the index's two-day cumulative change is near zero.
An intraday-flat strategy avoids intentionally carrying its position through the next session, but it still trades an instrument with leveraged intraday behavior, its own spread and its own tracking mechanics. Closing daily does not make TQQQ equivalent to QQQ with identical execution costs.
Compare QQQ and TQQQ using both account equity and risk measures. A larger percentage return can accompany a materially larger drawdown and tail exposure. The comparison should also disclose borrow availability for short trades, financing assumptions and any broker restrictions on leveraged ETFs.
Synthetic trend capture and repeated whipsaw
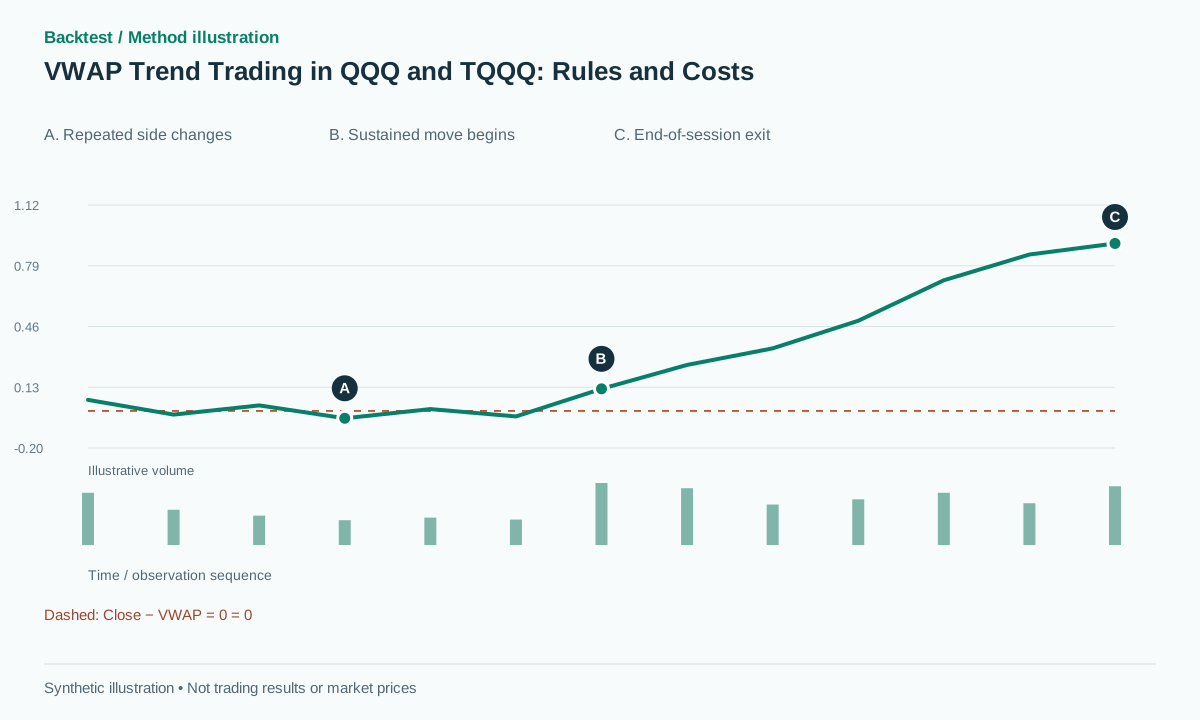
Suppose a completed bar closes above VWAP and the subsequent long entry fills at 100.12. A later exit at 101.20 earns $108 gross on 100 shares. The continuation is profitable because the sustained move is large enough to cover the entry and exit costs.
In a failed sequence, the same long closes at 100.02, losing $10 gross. The strategy then opens short at 100.02 and reverses again at 100.13, losing another $11 gross. The price has barely moved across the entire sequence, but the account has paid for multiple position changes.
A useful execution test places two crossings in adjacent completed bars. Verify that each signal uses only its own completed data, each order follows its signal timestamp, and the second reversal trades from the actual filled position. Also test a zero-volume bar, a missing minute and an exact close equal to VWAP.
The figure shows close minus VWAP, not an equity curve. Early observations alternate around zero; later ones remain positive. The example illustrates why a visual inspection of only the sustained trend can overlook the earlier churn that a full strategy must finance.
A validation plan that tests the fragile assumptions
Reconstruct session VWAP and target directions before assessing returns. Compare trade timestamps, reversal quantities and end-of-day exits against the intended rule. A mismatch in these intermediate outputs should be resolved directly rather than compensated with a new cost parameter.
Then run fixed variants: unfiltered crossings; a predefined minimum distance from VWAP; and a predefined persistence requirement. The latter two are proposed experiments, not rules claimed by the source. Each may reduce turnover while also delaying the rare large winners, so fewer trades alone is not evidence of improvement.
Report net expectancy, turnover, average holding time, the distribution of consecutive losses and the fraction of profit generated by the largest trades. Removing the largest winners is a sensitivity analysis, not an automatic rejection rule for a trend strategy. What matters is whether dependence on those winners is stable and economically plausible.
Use locked later periods and alternative market regimes. Stress the zero-slippage assumption with realistic spreads, execution latency and participation limits, and state whether borrow and financing are included. Keep the source's reported performance separate from all new hypotheses until an actual reproducible test exists.
Common pitfalls
Treating a low win rate as sufficient evidence against or for the system
Win frequency alone omits payoff size and cost. Reconstruct the complete net payoff distribution.
Charging only one leg of a reversal
Moving from long to equally sized short requires twice the one-sided quantity. Understated turnover directly inflates net results.
Calling full-equity TQQQ exposure unleveraged
The ETF targets leveraged daily index exposure internally. Account borrowing and product leverage are different layers.
Checklist before using this method
Check each item after verifying it on your data. Progress is saved in this browser; it does not certify a profitable strategy.
Frequently asked questions
Does a close above VWAP guarantee a bullish trend?
No. It is one directional condition. Repeated crossings in a range can create losses even while every signal follows the rule correctly.
Why is a zero-slippage assumption material here?
Frequent reversals create substantial turnover. Small per-share differences can accumulate, especially when many trades lose a small amount and profits depend on fewer large moves.
Research sources
Each source supports the definition or evidence described beside it. The pseudocode, synthetic examples and proposed parameters require separate validation.
- Volume Weighted Average Price (VWAP): The Holy Grail for Day Trading SystemsCarlo Zarattini, Andrew Aziz — 13/11/2023. Full 26-page paper dated 13 November 2023 read. Results use the authors' commission and zero-slippage assumptions; no backtest was rerun here. Checked: .
- TQQQ — UltraPro QQQProShares. Issuer documentation read for the three-times daily objective and holding-period compounding limitations, not as strategy-performance evidence. Checked: .
- Volume Weighted Average Price (VWAP)TradingView. Primary documentation read for VWAP construction and anchor behavior; it does not validate the trading strategy. Checked: .
Related methods
Risk note
This content supports education and research design, not financial advice. Backtest is historical simulation, does not guarantee future performance and does not place real trades. Methods in this library are not automatically features available in the app. See methodology and learning center.
Validate rules before risking real capital
Check app support, data and individual simulated trades; advanced detectors may require a separate implementation.
Download Backtest on the App Store