Backtesting basics
What Is Backtesting in Trading?
Reviewed by the Backtest Editorial Team · Editorial policy
Backtesting tests trading strategy rules on historical data before real capital is at risk, including entries, exits, fees, slippage, drawdown, and trade review.
Quick answer
Backtesting in trading means applying a set of strategy rules to historical market data to see what trades would have happened. A useful backtest does more than answer whether a chart looked good in hindsight. It defines entries, exits, position size, fees, slippage, stop loss, take profit, and the market period being tested. The result should show profit and loss, win rate, drawdown, profit factor, trade count, and trade-level evidence on the chart. Backtesting is research, not a forecast. It can expose weak rules before real money is at risk, but it cannot guarantee future performance.
What backtesting means in trading
A trading strategy starts as an idea: buy when a fast moving average rises above a slow moving average, exit when momentum fades, or test whether an oversold RSI recovery works better with a fixed take profit. Backtesting turns that idea into rules and runs those rules across historical candles in chronological order. If the rules would have opened a trade, the test records an entry. If the rules hit stop loss, take profit, signal exit, or the end of available data, the test records an exit.
Investopedia describes backtesting as reconstructing trades that would have happened in the past from strategy rules and historical data, then using the resulting statistics to evaluate the strategy. That framing is useful, but traders should add one more requirement: the result needs to be explainable trade by trade. A single headline number is not enough.
Why traders use backtesting before risking capital
Backtesting gives traders a slower, more honest way to challenge an idea. Without a test, it is easy to remember the clean winning examples and forget the noisy periods where the same rule chopped sideways. A backtest forces the strategy to face every candle in the selected period.
The most useful backtests answer practical questions: Did the rule produce enough trades to evaluate? Were wins larger than losses? Did realistic costs erase the edge? Did drawdown stay within a range the trader could tolerate? Did one large winner explain most of the profit? Did the setup fail in sideways markets, high-volatility periods, or trend reversals?
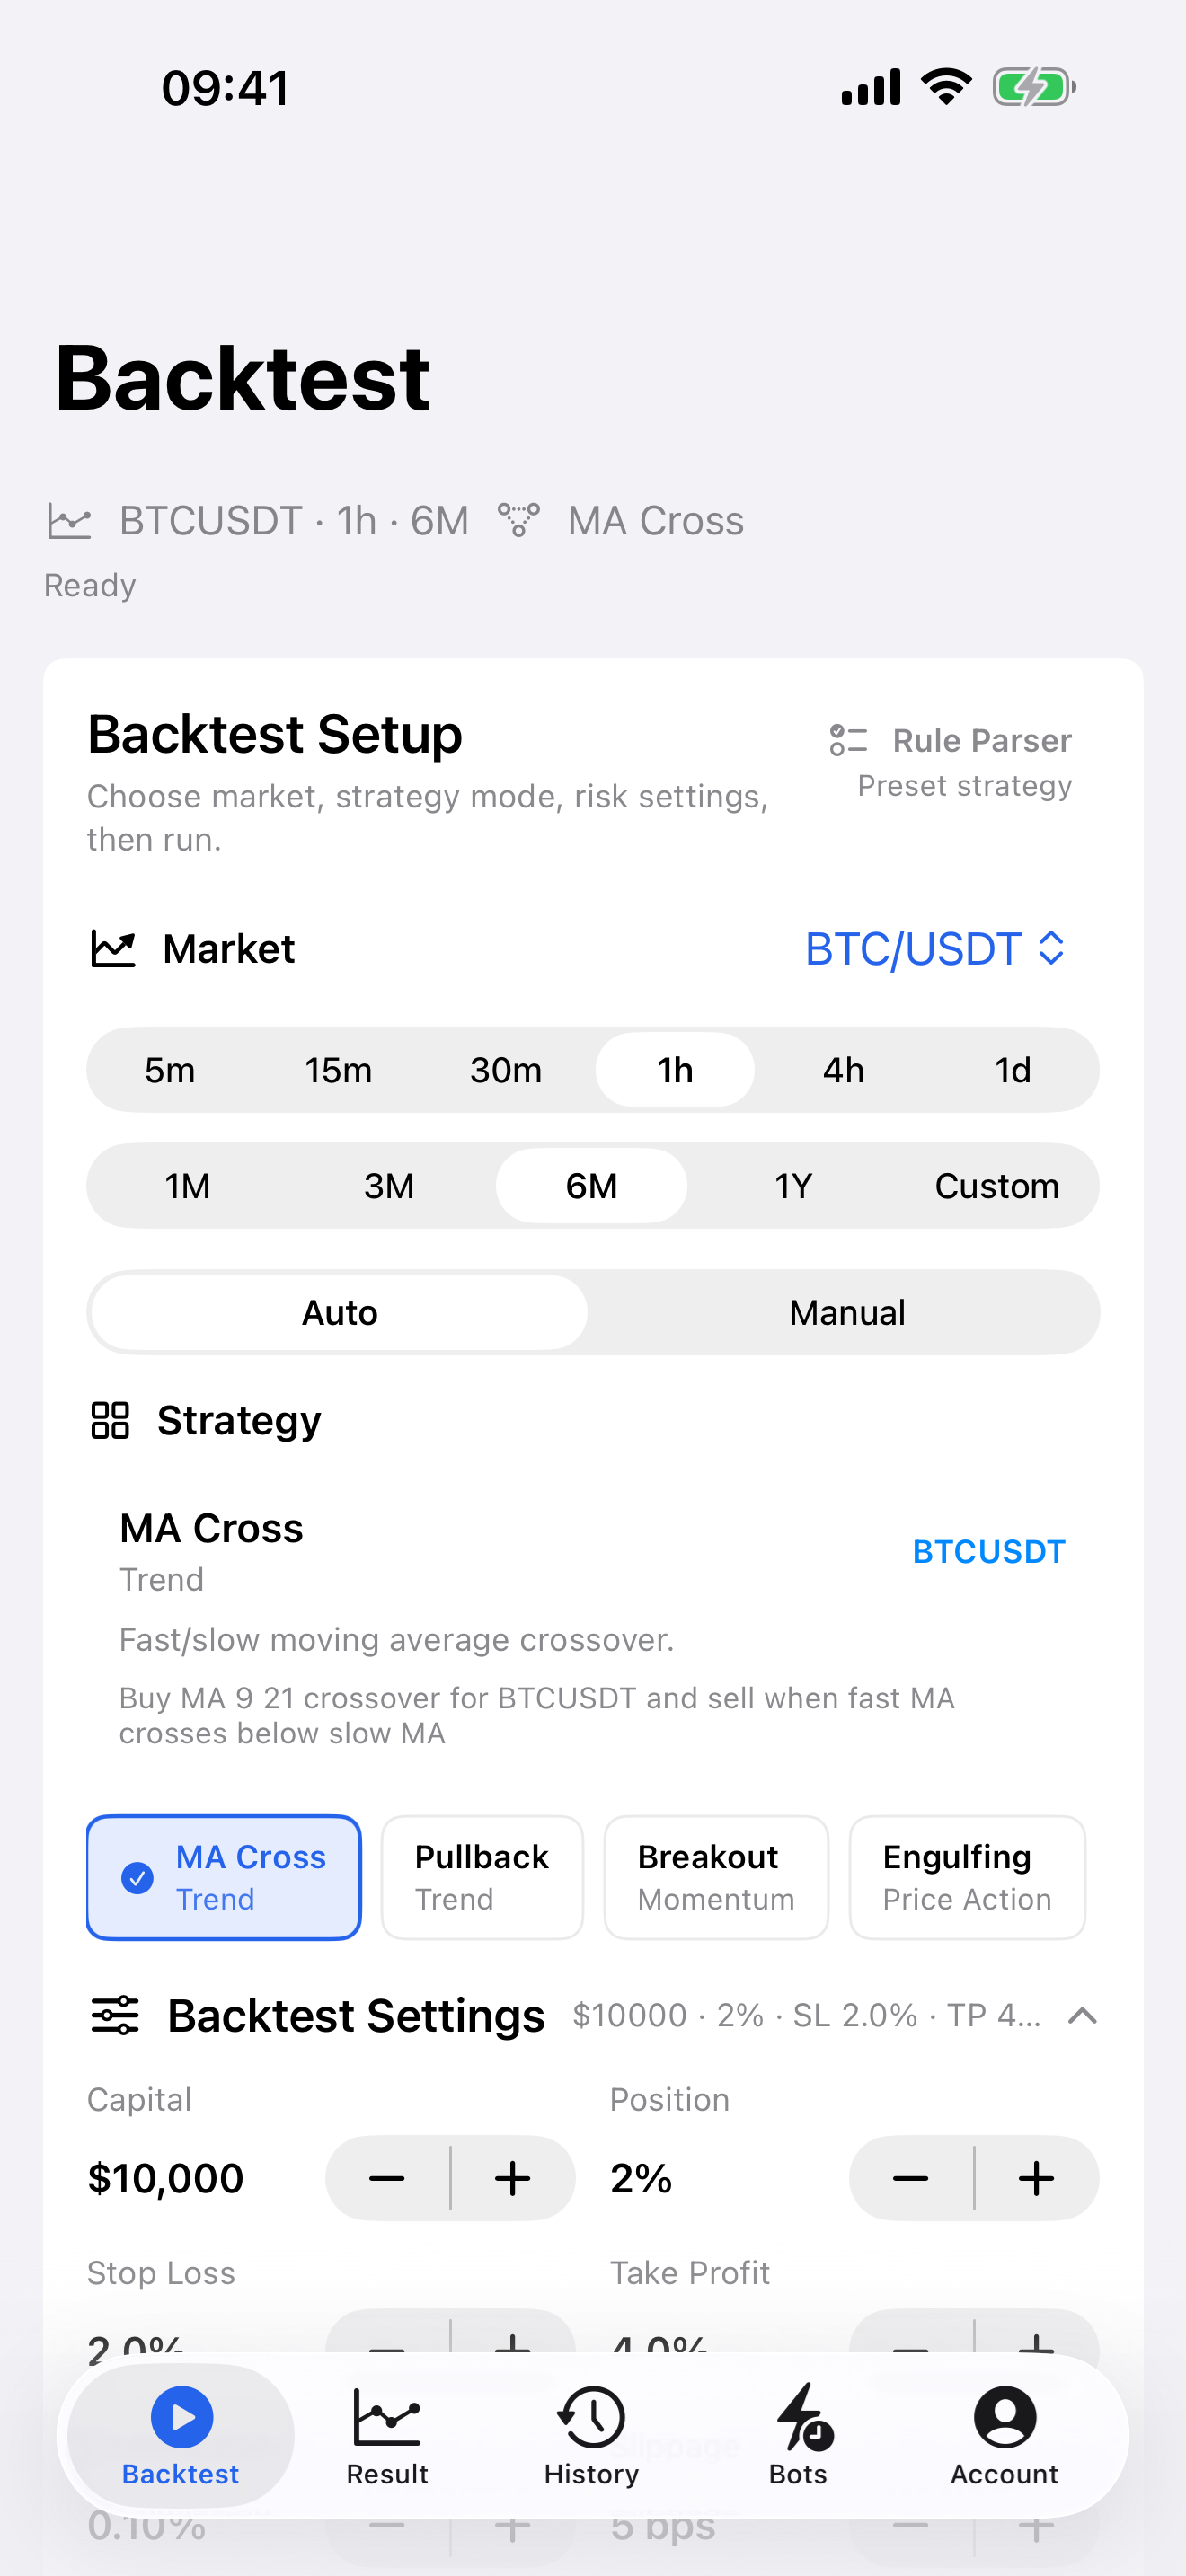
Backtest is built around those questions. It lets traders choose a symbol, timeframe, period, strategy mode, direction, position size, commission, slippage, stop loss, and take profit, then inspect summary metrics and individual trades on a chart.
Research context and limitations
External research and practitioner guidance agree on a few recurring points. First, the historical data must be detailed enough for the strategy being tested. A one-day candle cannot honestly evaluate a five-minute scalping rule. Second, transaction costs matter. Investopedia specifically calls out commission, slippage, position sizing, stop settings, and same-bar exit assumptions as settings that should resemble real trading conditions. Third, over-optimization is dangerous. A rule can be tuned so closely to one past period that it looks excellent historically but fails when market behavior changes.
A 2022 paper by Ao Sun and Yuh-Dauh Lyuu on backtesting and overfitting discusses the hazard of selecting strategies only because they performed well in sample. Even if a trader does not use machine-learning methods, the warning still applies: repeatedly changing parameters until one chart looks perfect is not the same as discovering a robust strategy. Backtesting should be paired with fresh data, paper trading, and conservative assumptions.
A practical Backtest app setup example
Here is a clean first test inside Backtest:
Symbol: BTC/USDT. Timeframe: 1H. Period: 6M. Strategy: MA Cross. Direction: long. Initial capital: 10,000 USD. Position size: 2%. Commission: 0.10%. Slippage: 5 bps. Stop loss: 2%. Take profit: 4%. Exit mode: TP/SL only.
This setup is intentionally simple. BTC/USDT is liquid and familiar to many crypto traders. A 1H timeframe creates enough candles for a medium-term test without turning the example into noise. A moving-average crossover is easy to understand: it tries to participate when a faster average moves above a slower average. The 2% stop and 4% take profit create a clear risk/reward structure, while commission and slippage keep the result from pretending trades are free.
How to read the result
Start with trade count. A result based on five trades is fragile even if the profit is high. Then inspect net profit after costs, not gross profit before costs. Check max drawdown because drawdown tells you how uncomfortable the losing path became before the final result appeared. Review win rate together with profit factor. A high win rate with tiny winners and occasional large losses can be weaker than a lower win rate where winners are much larger than losers.
Then open the chart. Look at the first few winners, the first few losers, and the largest loss. Ask whether the entries match the strategy idea or whether the rule is entering late. Check whether stop losses are being hit in clusters. If losses cluster during sideways periods, the strategy might need a trend filter. If exits happen too early, the take-profit setting may be too tight. If drawdown depends on one market crash, the strategy may need a volatility or regime filter.
Common beginner mistakes
The first mistake is ignoring costs. A strategy that trades often can look profitable before commission and slippage, then become flat or negative after realistic costs. The second mistake is testing one lucky market period. A strategy tested only during a strong bull trend may fail when volatility contracts or the market reverses.
The third mistake is changing parameters until the result looks perfect. This is overfitting. If the moving average lengths, RSI thresholds, stop loss, take profit, and date range are all adjusted repeatedly on the same period, the trader may be fitting noise instead of finding a repeatable behavior.
The fourth mistake is trusting a summary card without checking trades. A backtest should show where entries and exits happened. Visual review catches rule errors that metrics can hide. The fifth mistake is treating a backtest as a prediction. Backtesting is evidence for a hypothesis, not proof that the next trade will win.
Backtest vs paper trading
Backtesting and paper trading answer different questions. Backtesting asks, “What would this rule have done on historical data?” Paper trading asks, “How does this rule behave from now on without real capital?” A healthy workflow uses both. First, backtest a simple rule with realistic costs. Second, reject rules with too few trades, poor profit factor, unacceptable drawdown, or obvious chart-level problems. Third, monitor the surviving setup with paper signals before risking capital.
Backtest supports this progression by combining historical tests, saved history, saved result comparison for authenticated users, and realtime paper/signal bots. The bot feature is still simulation and notification only. It does not place real trades.
Practical checklist
Before trusting any backtest, answer these questions: 1. Are the entry and exit rules specific enough to test? 2. Does the timeframe match the strategy idea? 3. Are commission and slippage included? 4. Is the test period long enough to include more than one market mood? 5. Is trade count high enough to avoid judging from one lucky move? 6. Is max drawdown acceptable? 7. Does profit factor remain healthy after costs? 8. Do chart-level trades match the intended logic? 9. Is the result dependent on one oversized winner? 10. Has the setup been monitored forward through paper trading?
Risk note
Backtest is for education and strategy research. It is not financial advice, investment advice, a brokerage, an exchange, or an order execution platform. Historical simulation does not guarantee future performance. Trading crypto, forex, gold, stocks, futures, and other financial assets is risky, and users can lose capital. AI rule parsing and paper signal bots can be wrong and should be treated as research support only.
Research sources
- Google Search Central: helpful, reliable, people-first content
- Google Search Central: localized versions and hreflang
- Google Search Central: image SEO best practices
- Google Search Central: Article structured data
- Investopedia: Backtesting Trading Strategies
- Sun and Lyuu: Backtesting Trading Strategies with GAN To Avoid Overfitting
Related guides
Backtest Trading for iOS
Continue your research on iPhone
Run another setup, inspect every simulated trade, and keep your strategy research close at hand.
Download on the App Store