Strategy research · Updated July 13, 2026
Trading Strategy Tester: How to Test Rules Before Trading
Reviewed by the Backtest Editorial Team · Editorial policy
Use a trading strategy tester to define rules, include costs and risk controls, inspect trades, and reject weak ideas before risking capital.
Quick answer
A trading strategy tester turns a trading idea into a repeatable historical simulation. The useful version is not a box that produces a profit number; it lets you state the market, timeframe, entry, exit, direction, position size, commission, slippage, stop loss, and take profit, then inspect what actually happened trade by trade. Use it to disprove weak ideas before risking capital, not to predict the next trade.
What a useful strategy tester should show
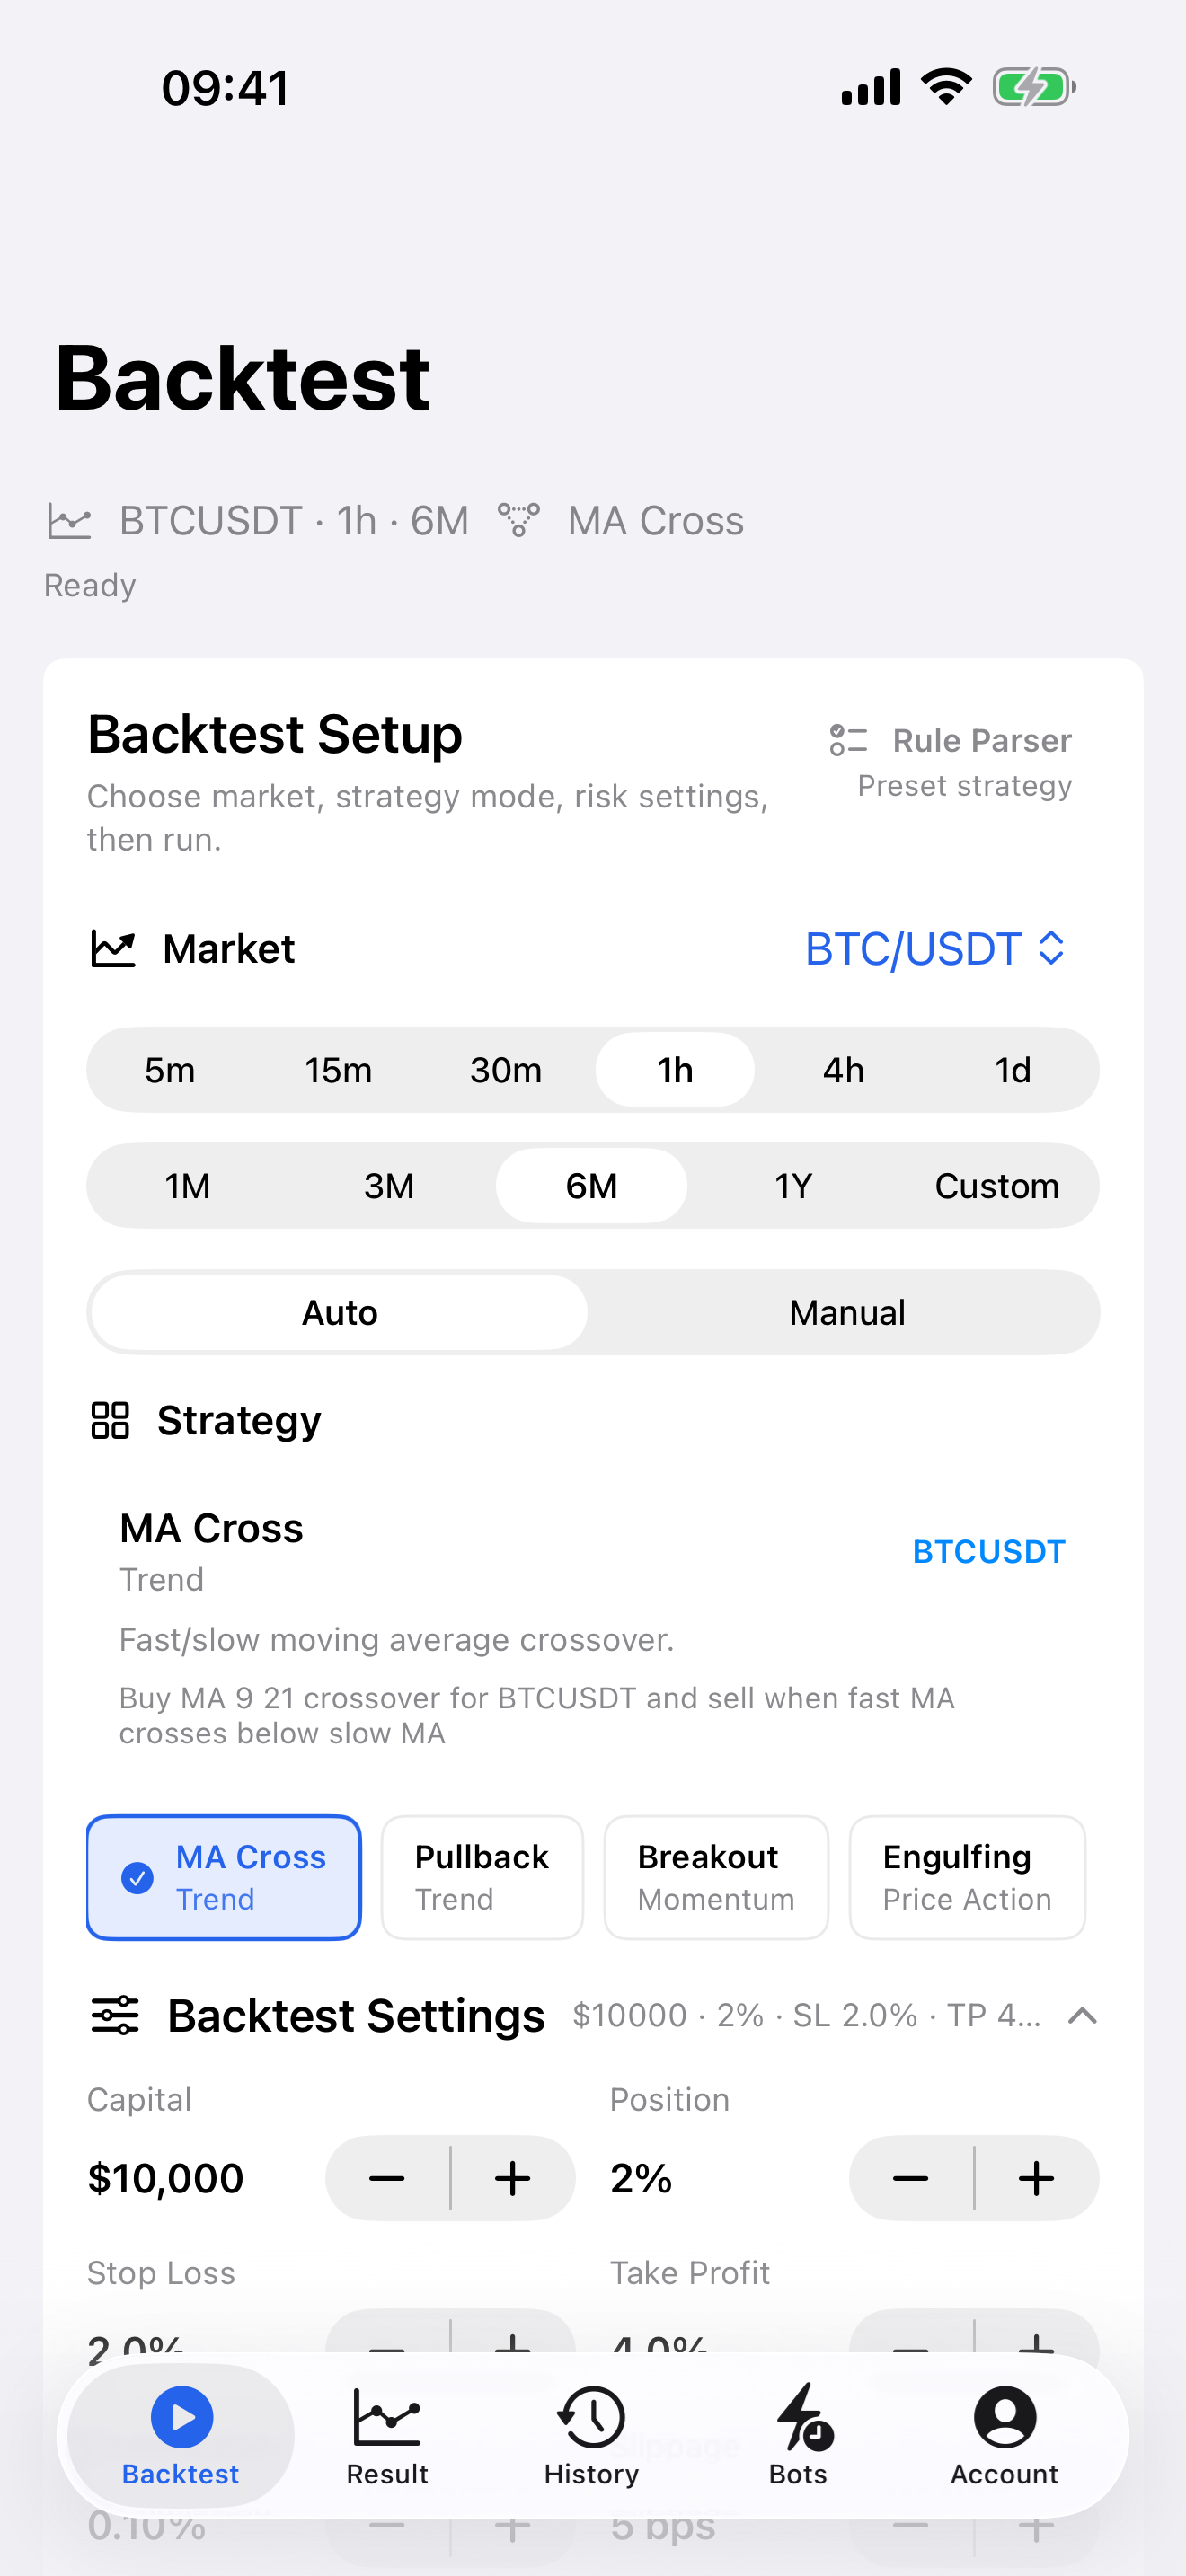
Start with explicit rules. “Buy when momentum looks strong” is not testable until it becomes a condition: for example, a moving-average cross, a pullback into a defined zone, or an RSI recovery with a fixed exit. The tester should then apply those conditions in chronological order. Backtest supports preset strategies and manual rules, plus long-only, short-only, and both-direction testing. That makes it possible to compare the same idea without quietly changing its direction or risk profile.
Next, require evidence. Net profit alone is weak evidence. Review trade count, profit factor, max drawdown, win rate, equity curve, fees, and the entry and exit markers on the chart. A high win rate can still hide infrequent but damaging losses. A positive result can depend on one unusually large winner. The point of the tester is to make those weaknesses visible.
Backtest setup example
Use BTC/USDT, 1H candles, six months, a Pullback strategy, both directions, 2% position size, 0.10% commission, 5 bps slippage, 2% stop loss, and 4% take profit. Run the test, save the setup, then repeat it on a later period without changing the rules. Compare net result after costs, trade count, profit factor, and max drawdown. If the idea only works in one favourable trend, that is a finding, not a reason to tune every input until the result improves.
How to read the result
First confirm the configuration. A result based on the wrong timeframe or omitted costs is not useful. Then look at the sample: a handful of trades does not establish a reliable distribution of outcomes. Read net profit alongside profit factor and drawdown. Finally, open several individual trades: the largest winner, largest loss, and a cluster of consecutive losses. This visual review exposes late entries, exits that are too tight, and strategies that struggle in sideways conditions.
TradingView's broker-emulator documentation makes the same general point: fill assumptions, commission, and the price model change a simulated result. A tester that exposes those assumptions is more useful than one that hides them behind a single score.
Common mistakes
- Testing a five-minute idea on daily data.
- Leaving commission and slippage at zero.
- Optimizing indicator lengths, stops, targets, and dates on one period until the chart looks perfect.
- Judging a strategy only by win rate.
- Skipping the forward paper-monitoring step after a historical result.
Risk note
Backtest is for education and strategy research. It is not financial advice, investment advice, a brokerage, an exchange, or an order execution platform. Historical simulation does not guarantee future performance. Trading can result in loss of capital. AI rule parsing and paper signal bots can be wrong and should be treated as research support only.
Research sources
Related guides
Backtest Trading for iOS
Continue your research on iPhone
Run another setup, inspect every simulated trade, and keep your strategy research close at hand.
Download on the App Store