Bitcoin strategy research
BTC Backtest Example: Fees, Slippage, Drawdown, and Trade Review
Reviewed by the Backtest Editorial Team · Editorial policy
Follow a reproducible BTC backtest example with RSI rules, realistic fees and slippage, drawdown analysis, trade review, and holdout checks.
Quick answer
A useful BTC backtest example is a controlled experiment, not a screenshot of a profitable curve. Define the rule and every execution assumption first, run it chronologically, then ask whether the result remains credible after trading costs, drawdown, unusual trades, and an unseen period are considered. One strong number cannot answer those questions.
In Backtest, start with BTCUSDT, 1-hour candles, six months, RSI, long only, 2% position size, 0.10% commission, 5 basis points of slippage, a 2% stop loss, a 4% take profit, and signal-and-risk exits. Treat the output as a historical simulation. Do not copy any displayed return into an expectation. Instead, verify the setup, compare gross logic with net-of-cost results, inspect maximum drawdown and every outlier trade, then run higher-cost and holdout checks without retuning.
What this BTC backtest example is designed to test
The hypothesis is intentionally modest: after BTC becomes oversold on the one-hour timeframe, does a rules-based long entry followed by an RSI reversal or predefined risk exit produce a repeatable distribution of simulated trades? “Bitcoin usually bounces” is not testable. A fixed RSI rule, direction, exit policy, risk boundary, and cost model is.
The test is not designed to prove that RSI predicts Bitcoin, identify the best threshold, or forecast the next six months. It also does not model a complete exchange. One-hour OHLC candles compress all activity inside each hour; they do not reveal order-book depth, queue position, latency, partial fills, or the exact order in which intrabar prices traded. Funding, liquidation rules, spread changes, taxes, outages, and venue-specific discounts may also sit outside the model.
This narrow framing is a strength. It gives you a falsifiable research question: did the exact rule behave consistently enough, under conservative assumptions, to justify another round of testing? A negative or inconclusive result saves time. A positive result is permission to challenge the idea more aggressively—not permission to trade it.
Research context: why costs, path, and trial count matter
The CFA Institute’s 2026 backtesting and simulation reading describes the objective of backtesting as understanding a strategy’s risk–return trade-off while approximating the real investment process. It also emphasizes rolling or walk-forward evaluation, sensitivity analysis, look-ahead bias, survivorship bias, structural breaks, and downside behavior. For a BTC test, that means the path to the final result matters as much as the endpoint.
Costs need the same seriousness. The CFA Institute’s 2026 trading-costs reading explains that implementation shortfall captures both explicit and implicit costs. Backtest’s commission and slippage inputs are simplified estimates, but making them visible is better than silently assuming perfect execution. A 0.10% commission charged on entry and exit is roughly 0.20% round-trip before slippage; 5 bps on each side adds roughly another 0.10%. Exact compounding and price movement change the realized value, but the arithmetic shows why a frequent strategy can lose its apparent edge quickly.
Repeated searching creates another hidden cost: false discovery. Bailey, Borwein, López de Prado, and Zhu’s peer-reviewed work on the probability of backtest overfitting provides a framework for estimating how often selecting the winner from many historical trials produces a strategy that degrades out of sample. In practical terms, record every threshold, stop, target, period, and direction tried. The fifth configuration is not independent evidence if the first four informed it.
Finally, Bitcoin itself carries risks a chart cannot eliminate. The U.S. Commodity Futures Trading Commission highlights volatility, flash crashes, manipulation, cyber risk, platform safeguards, and the amplifying effect of leverage. Those are reasons to keep the example unlevered and educational. They are also reminders that clean historical candles are not the same thing as safe live execution.
Backtest app setup example
Open Backtest and enter the following configuration before viewing any result. Save a note or screenshot of the inputs so later changes cannot be forgotten.
| Input | Value | Research reason |
|---|---|---|
| Market | BTCUSDT | A liquid Bitcoin quote pair with familiar price behavior; provider and venue differences still matter. |
| Timeframe and period | 1h, 6M | Enough bars for a worked example without pretending one regime represents all Bitcoin history. |
| Strategy and direction | RSI, long only | Tests oversold recovery without mixing a different short-side hypothesis into the sample. |
| Exit mode | Signal and risk | Allows the rule to reverse while keeping explicit loss and reward boundaries. |
| Position size | 2% | Keeps the example focused on trade behavior rather than aggressive capital exposure. |
| Commission | 0.10% per fill | A transparent illustrative assumption; replace it with your actual venue and tier. |
| Slippage | 5 bps per fill | Introduces execution friction without claiming to reproduce an order book. |
| Stop / target | 2% / 4% | A fixed 1:2 price-distance comparison; it does not imply a 1:2 realized payoff. |
Run the baseline once. Then create named variants rather than editing the baseline: slippage at 10 bps and 20 bps; commission matched to your intended venue; stop loss at 1.5%, 2%, and 2.5%; and a later holdout period. Do not change the RSI logic, stop, target, and date range together because you will not know which assumption caused the difference.
Backtest processes historical observations chronologically and applies the configured strategy and risk settings to simulated trades. Read the Backtest methodology alongside the result. The application is a research and paper-signal tool; it does not connect this example to a brokerage account or place a real BTC order.
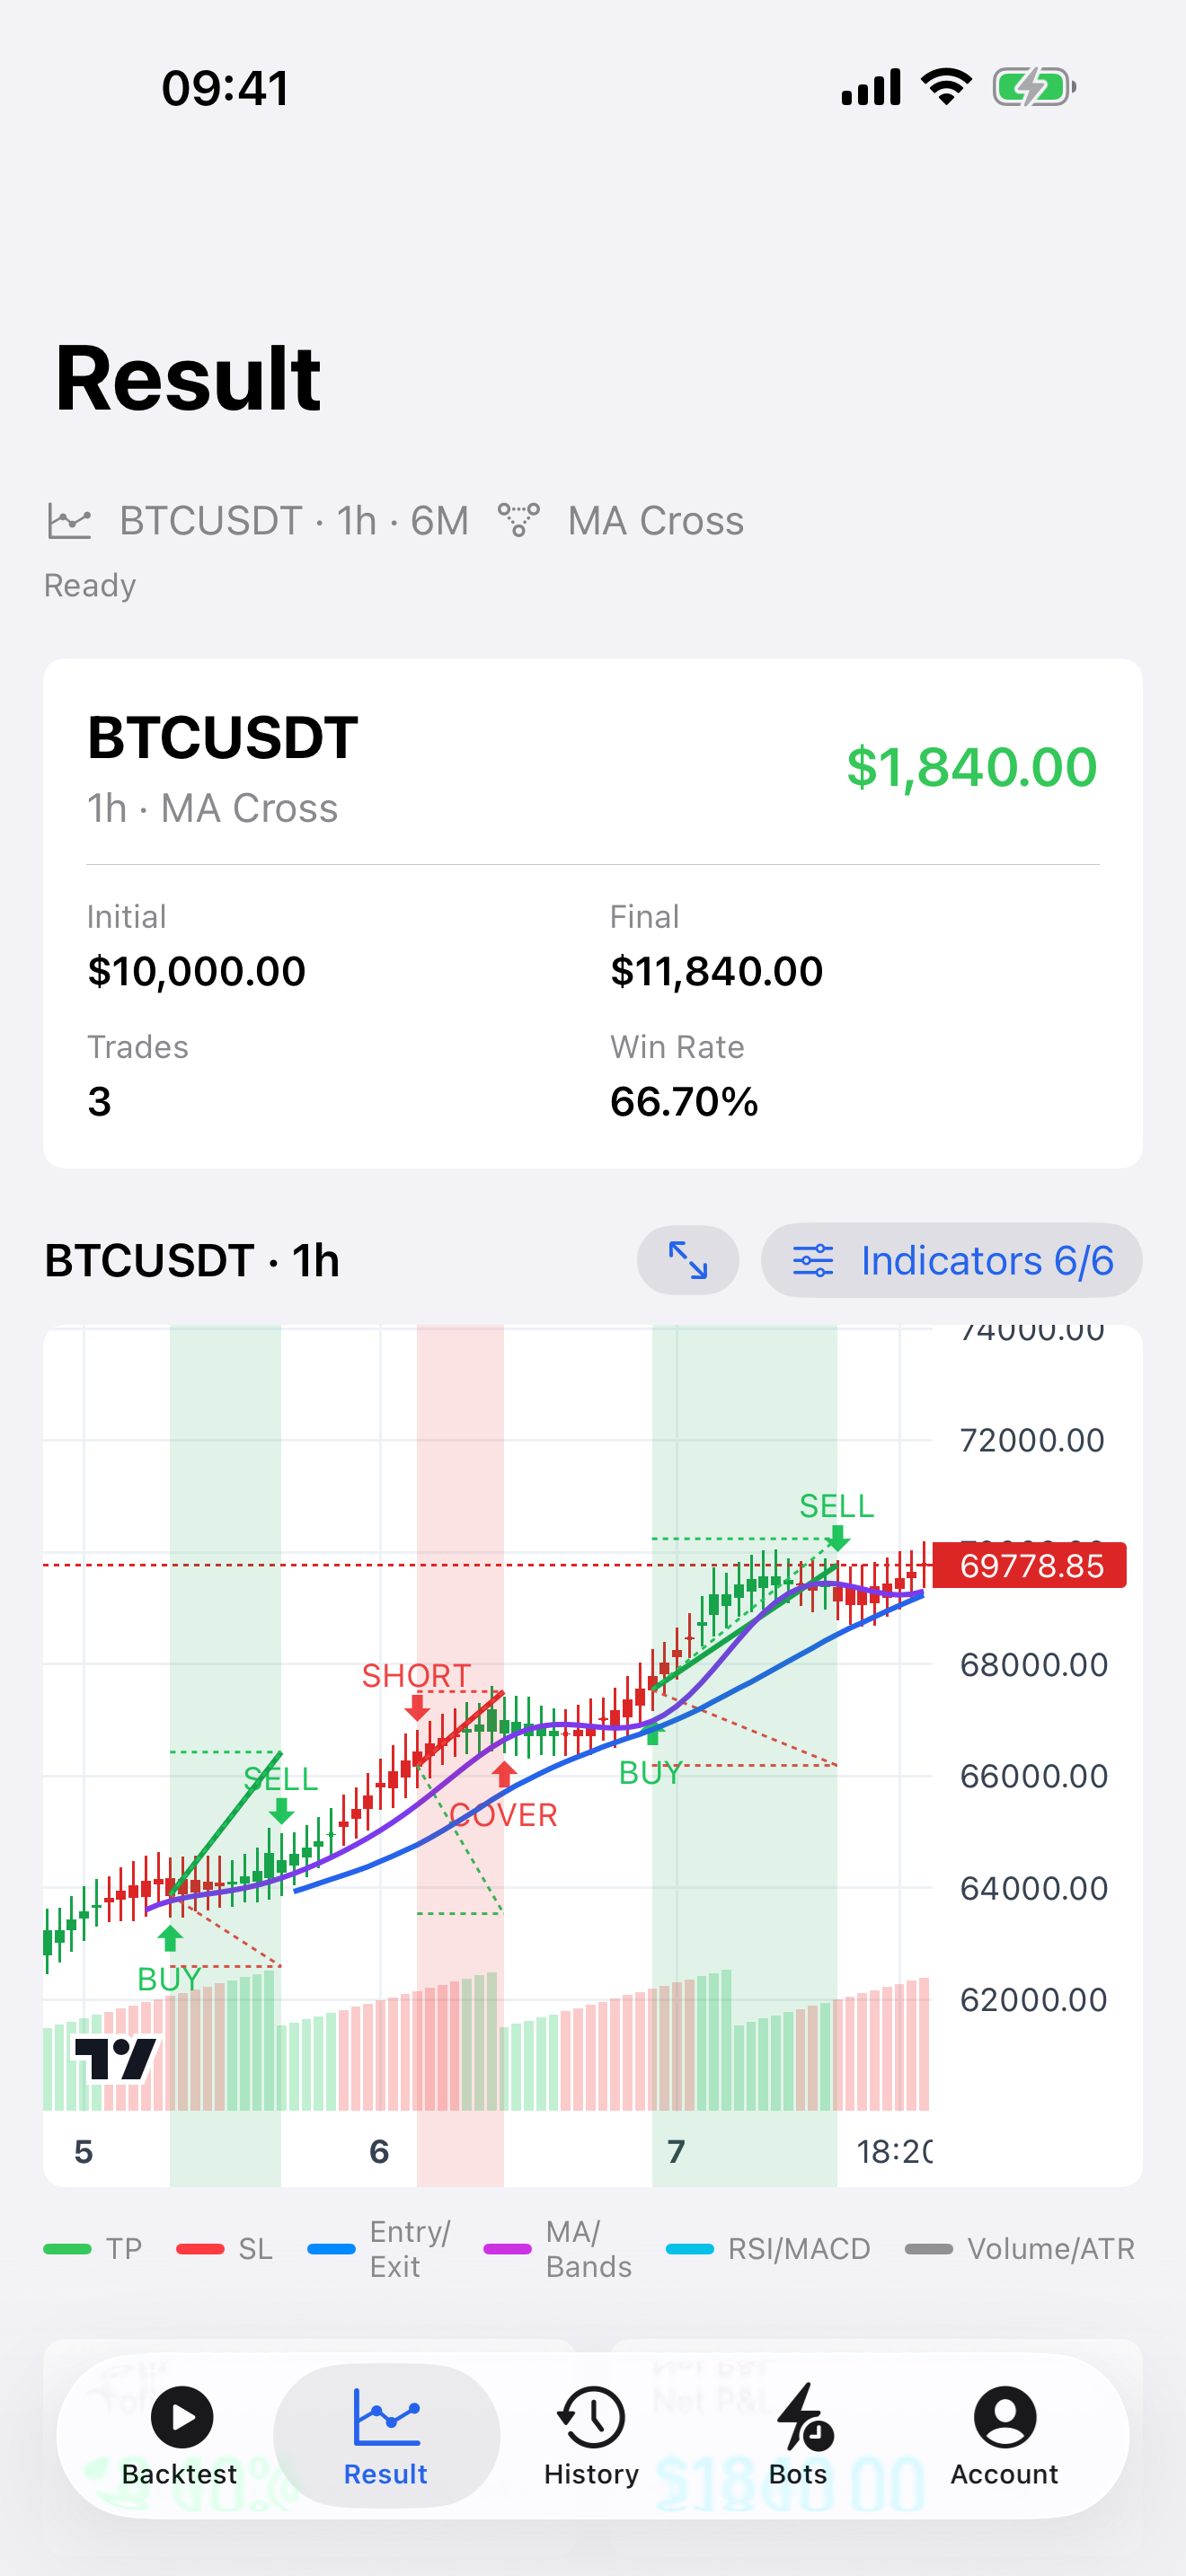
How fees and slippage change the result
Commission is explicit: the venue charges it according to product, order type, volume tier, and other rules. Slippage is the difference between an assumed decision price and the fill you actually obtain. In a candle-based historical test, the slippage field is a controlled penalty—not a claim that every live order would slip by the same amount.
Suppose the baseline produces 40 completed trades. Each round trip has two sides, so a simple 0.10% commission plus 5 bps slippage per side represents approximately 0.30% friction per round trip before compounding and varying notional size. That is not a forecast of total cost, but it is a useful reasonableness check. If the typical gross trade has only a 0.20% move, the model is asking a very small signal to overcome a larger assumed hurdle.
Compare the baseline with 10 bps and 20 bps slippage. Watch net result, profit factor, the number of marginal winners that become losers, and whether the equity curve’s shape changes. A gradual decline suggests a modest edge may be cost-sensitive. A complete collapse under a small change suggests the apparent edge was mostly friction-free arithmetic. Neither conclusion can be recovered by pointing to a high win rate.
How to read the results
1. Reconfirm the inputs
Before reading performance, confirm symbol, timeframe, period, strategy, direction, exit mode, position size, commission, slippage, stop, and target. A surprising result is often an input mismatch. Record the data timestamp and provider when available.
2. Read net result with sample size
Net result matters only with the number of trades and exposure. Three winning trades are not equivalent to sixty trades across different market conditions. More trades do not automatically make a strategy valid, but a tiny sample gives wide uncertainty and lets one outlier dominate.
3. Pair profit factor with the payoff distribution
Profit factor compares gross simulated profits with gross simulated losses. Inspect average win, average loss, win rate, and the largest win alongside it. A reasonable profit factor driven by one exceptional winner may be fragile. Remove that trade mentally—or in a separate research copy—and see whether the interpretation changes.
4. Study maximum drawdown as an experience
Maximum drawdown is the largest peak-to-trough decline in the modeled equity path. Note its depth, start, duration, recovery time, and cluster of trades. A 10% drawdown recovered in days is behaviorally and operationally different from the same depth lasting months. Historical maximum drawdown is not a ceiling; a future decline can be larger.
5. Review trades on the chart
Open the largest winner, largest loser, several ordinary wins and losses, and every trade in the worst losing streak. Ask whether entries occur after the information was available, whether gaps or long candles create implausible fills, and whether stop/target ordering inside a candle is ambiguous. Trade review turns a summary statistic into auditable evidence.
6. Separate in-sample and holdout conclusions
Freeze the rules before running the later period. If you change the rules after seeing that period, it becomes part of the training process and you need a new holdout. A stable but mediocre result may teach more than a spectacular in-sample curve that reverses immediately.
Common mistakes
- Using zero friction. A frequent RSI strategy can look attractive before costs and weak after them.
- Quoting the final return alone. Return hides drawdown path, exposure, trade count, and concentration.
- Tuning until BTC history agrees. Every viewed configuration increases the risk of fitting noise.
- Assuming a 2% stop limits every loss to 2%. Gaps, slippage, candle resolution, position sizing, and execution rules affect realized loss.
- Calling a 4% target a guaranteed 2:1 payoff. Signal exits and costs change the realized win/loss distribution.
- Ignoring time in drawdown. Depth alone misses long recovery periods and strategy abandonment risk.
- Treating OHLC bars as tick-by-tick evidence. Intrabar ordering and liquidity are simplified.
- Using the holdout repeatedly. A repeatedly consulted holdout becomes another optimization sample.
- Confusing paper signals with execution. Monitoring a rule forward does not reproduce fills, custody, or exchange operations.
Practical checklist
- Write the BTC RSI entry and exit hypothesis before opening the result.
- Set BTCUSDT, 1h, six months, long only, signal-and-risk exits, 2% size, 0.10% commission, 5 bps slippage, 2% stop, and 4% target.
- Verify the data source, time range, missing bars, and candle resolution.
- Save the baseline and log every later variation.
- Read net result, profit factor, trade count, exposure, and drawdown together.
- Inspect the largest winner, largest loser, normal trades, and worst losing streak.
- Run 10 bps and 20 bps slippage cases plus a venue-specific commission case.
- Change one assumption at a time and look for a stable neighborhood, not a perfect point.
- Freeze the rule before testing a later holdout period.
- If the result survives, observe it with paper signals before considering any real-world decision.
Risk note
Backtest is for education and strategy research. It is not financial advice, investment advice, a broker, an exchange, or an order-execution service. Historical simulation does not guarantee future performance, and maximum historical drawdown is not a maximum future loss. Bitcoin is highly volatile and can involve market, liquidity, gap, platform, custody, cyber, regulatory, and total-loss risks. Commission, spread, slippage, funding, taxes, and live fills may differ materially from the model. Parsed strategy rules and paper signals can be wrong. Do not risk capital you cannot afford to lose.
Research sources
- CFA Institute: Backtesting & Simulation (2026 curriculum)
- CFA Institute: Trading Costs and Electronic Markets (2026 curriculum)
- Bailey, Borwein, López de Prado, and Zhu: The Probability of Backtest Overfitting
- U.S. CFTC: Understand the Risks of Virtual Currency Trading
- U.S. CFTC: A CFTC Primer on Virtual Currencies
- Backtest methodology and limitations
Related guides
Open the BTCUSDT RSI research setup
Backtest Trading for iOS
Continue your research on iPhone
Run another setup, inspect every simulated trade, and keep your strategy research close at hand.
Download on the App Store