Crypto strategy research
Crypto Strategy Tester: How to Test Rules Before Trading
Reviewed by the Backtest Editorial Team · Editorial policy
Use a crypto strategy tester to evaluate BTC, ETH, and SOL rules with realistic fees, slippage, drawdown, trade review, and out-of-sample checks.
Quick answer
A crypto strategy tester turns a precise trading idea into simulated entries and exits on historical candles. A useful test fixes the market, timeframe, date range, entry and exit rules, direction, position size, commission, slippage, stop loss, and take profit before looking at performance. It then exposes net result, trade count, profit factor, maximum drawdown, equity curve, and each simulated trade. The point is not to discover a guaranteed winner. It is to find where a rule breaks before real capital is exposed.
For a reproducible first pass in Backtest, use BTCUSDT, ETHUSDT, and SOLUSDT on the 1-hour timeframe over six months with the Pullback preset, both directions, 2% position size, 0.10% commission, 5 basis points of slippage, a 2% stop loss, a 4% take profit, and signal-and-risk exits. Keep every assumption unchanged across the three symbols. Compare robustness rather than choosing whichever chart has the highest return. Backtest performs historical simulation and paper-signal research; it does not place real trades.
What a crypto strategy tester can and cannot answer
A tester can answer a conditional question: if these rules had been applied to this candle series, with these simplified cost and fill assumptions, what simulated trades would have resulted? That is much narrower than “will this strategy make money?” The distinction matters in crypto because trading is continuous, liquidity differs sharply across pairs and venues, and a candle compresses many transactions into one open, high, low, and close.
A credible test makes the hypothesis falsifiable. “Buy pullbacks in an uptrend” is an idea, not yet a rule. The test needs a defined trend filter, pullback trigger, entry timing, exit condition, and invalidation point. It also needs to say whether short positions are allowed and what happens if a stop and target are both touched inside the same candle. Backtest publishes its chronological, single-position methodology and applies configured commission and slippage at simulated entry and exit. That transparency lets you judge the model rather than treating the output as an oracle.
The tester cannot reproduce queue position, order-book depth, latency, funding, liquidation, exchange outages, taxes, or every venue-specific fee. It also cannot repair incomplete history. Coinbase's candle documentation explicitly notes that historical rates may be incomplete and that intervals with no ticks may have no published data. A clean equity curve is therefore only evidence about the model and sample that produced it.
Research context: crypto data, costs, and overfitting
Three research facts should shape the workflow. First, market data has a source and a structure. Binance's current Spot API documentation says responses are chronological unless noted otherwise and distinguishes data drawn from the matching engine, memory, and database. Coinbase describes candles as grouped historical buckets and warns that historical rates can be incomplete. These are practical reminders to verify the symbol, provider, interval, time zone, missing bars, and test window before interpreting any metric.
Second, execution friction is not one universal percentage. Coinbase Advanced explains that maker and taker orders have different fees, and that fee tiers depend on recent trading volume. Backtest's commission and slippage fields are deliberately explicit approximations. Use assumptions that match the venue and order behavior you intend to study, then run sensitivity tests. A setup that survives only at zero cost has not survived a realistic research check.
Third, repeated searching creates selection bias. Bailey, Borwein, López de Prado, and Zhu's work on the probability of backtest overfitting addresses the danger of choosing the best result from many tried configurations. The retail version is easy to recognize: change an indicator length, date range, stop, target, and direction until one combination looks exceptional. Record every trial, reserve a later period, and prefer a broad plateau of acceptable settings over a single sharp optimum.
Finally, risk remains outside the spreadsheet. The U.S. Commodity Futures Trading Commission warns about virtual-currency volatility, flash crashes, manipulation, cyber risks, and platform safeguards. A strategy test can estimate the historical behavior of rules; it cannot remove market, counterparty, operational, or custody risk.
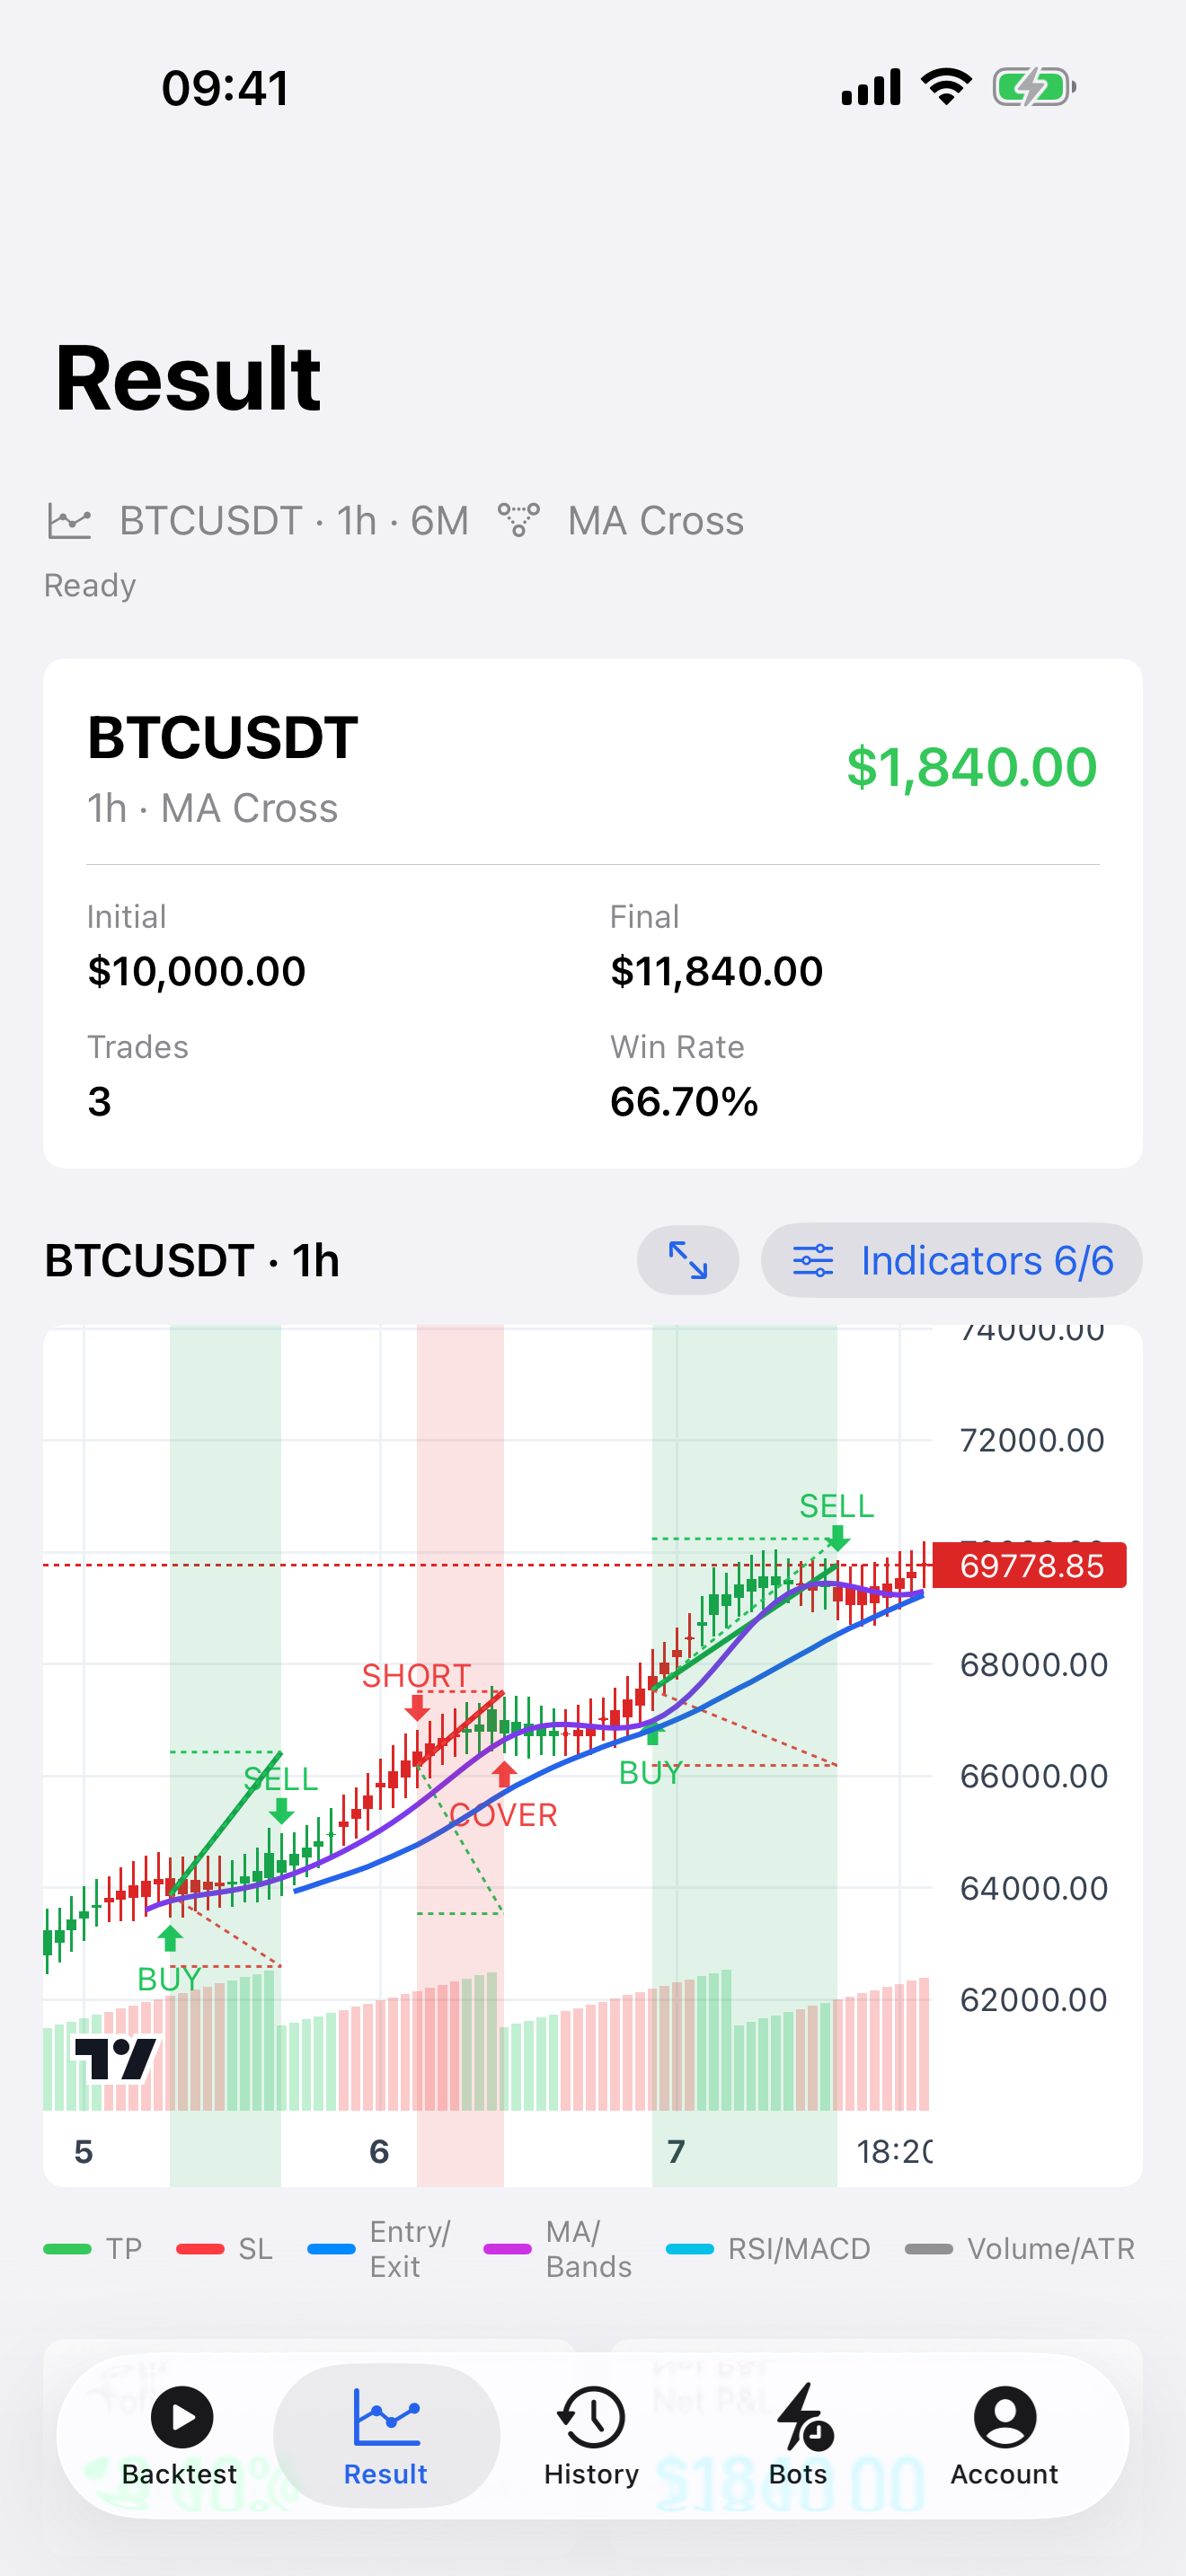
Backtest app setup example: BTCUSDT, ETHUSDT, and SOLUSDT
Start with one controlled experiment. In Backtest select BTCUSDT, 1h, 6M, the Pullback preset, and both directions. Set position size to 2%, commission to 0.10% per configured charge, slippage to 5 bps, stop loss to 2%, take profit to 4%, and use the exit mode that allows both the strategy signal and risk controls to close a trade. These values are a research example, not recommended settings.
Save the result, then clone the configuration for ETHUSDT and SOLUSDT without changing any other field. This is a cross-market stability check. BTC, ETH, and SOL do not have identical volatility or liquidity, so equal percentage stops will not create equal risk dynamics. That is useful: the comparison reveals whether the rule is broadly connected to pullback behavior or accidentally fitted to one symbol's recent path.
Next, rerun the three symbols with a later holdout period if the data window allows. Do not retune the rule on the holdout. Finally, perform two sensitivity checks: raise slippage from 5 to 10 and 20 bps, and compare long-only with both directions. If the conclusion reverses after a small cost increase or depends entirely on short trades during one decline, write that limitation beside the saved result.
The app's paper signal bot can monitor a surviving setup forward. It produces simulated signals and notifications; it does not connect to an exchange or execute orders. Forward observation is valuable because it separates a rule chosen with historical knowledge from decisions made after the rule was frozen.
How to read the results
1. Verify the experiment
Before reading profit, confirm symbol, timeframe, period, strategy, direction, position size, costs, stop, target, and exit mode. Then inspect whether the chart markers align with the intended pullback logic. A good metric from the wrong configuration is not useful evidence.
2. Check sample depth and concentration
Trade count matters because a handful of outcomes cannot describe a distribution well. But hundreds of correlated trades are not automatically independent evidence. Inspect whether profit comes from one asset, one month, one market regime, or one unusually large winner. Backtest's confidence score considers several sample-quality inputs, including trade and candle counts, profit factor, costs, drawdown, and concentration; it is a diagnostic, not a prediction.
3. Read return, profit factor, and drawdown together
Net result shows the modeled outcome after configured costs. Profit factor compares gross profit with gross loss. Maximum drawdown shows the worst peak-to-trough path in the sample. A high win rate can coexist with poor profit factor when losses are much larger than wins, while a positive result can still require a drawdown that would be difficult to tolerate. Compare metrics as a system.
4. Open the trades
Review the largest win, largest loss, several ordinary trades, and a cluster of consecutive losses. Look for late entries, exits within volatile bars, repeated whipsaws, gaps in candle history, and cases where the stop or target assumption materially changes the outcome. Trade review is where a plausible statistic becomes an explainable sequence.
5. Demand stability
A result earns more attention when its broad conclusion survives nearby cost assumptions, another symbol, and a genuinely unseen period without extensive retuning. Stability does not guarantee live performance. Instability, however, is a strong reason to stop or redesign the hypothesis.
Common mistakes
- Starting with the best-performing coin. Choose the test universe before viewing outcomes, or you introduce survivorship and selection bias.
- Using today's symbol history as if it were always tradeable. Listings, liquidity, tick size, and venue availability change over time.
- Setting commission and slippage to zero. Costs compound across entry and exit and can erase frequent small gains.
- Treating a one-hour candle as an exact fill record. Intrabar order and order-book depth are not fully visible in OHLC data.
- Optimizing on the full history. Preserve a holdout period and keep a log of every configuration tried.
- Comparing BTC, ETH, and SOL only by final return. Also compare trade count, drawdown, concentration, and cost sensitivity.
- Assuming paper signals are live execution. They are a forward research bridge, not orders or guaranteed fills.
- Ignoring operational risk. Exchange, custody, security, regulatory, and connectivity risks sit outside the backtest.
Practical checklist
- Write the entry, exit, direction, and invalidation rule before opening results.
- Record the data provider, symbol, timeframe, date range, and any missing-bar concern.
- Enter venue-aware commission and a conservative slippage estimate.
- Freeze the BTCUSDT Pullback setup before cloning it to ETHUSDT and SOLUSDT.
- Read net result, profit factor, drawdown, trade count, and concentration together.
- Inspect the largest win, largest loss, ordinary trades, and consecutive losses on the chart.
- Test higher costs and nearby parameters without searching endlessly for a peak.
- Reserve an unseen period and do not retune on it.
- Observe a surviving rule with paper signals before considering real capital.
- Document why the idea failed as carefully as why it appeared to work.
Risk note
Backtest is an education and strategy-research tool. It is not financial advice, investment advice, a broker, an exchange, or an order-execution platform. Historical simulation does not guarantee future performance. Crypto assets can be extremely volatile and involve market, liquidity, platform, custody, cyber, regulatory, and total-loss risks. Fees, slippage, funding, taxes, and live fills may differ materially from modeled assumptions. Parsed strategy rules and paper signals can be wrong. Never risk capital you cannot afford to lose.
Research sources
- Binance Developer Documentation: Spot REST API and data sources
- Coinbase Developer Documentation: historical product candles
- Coinbase Help: Advanced maker and taker fees
- Bailey, Borwein, López de Prado, and Zhu: The Probability of Backtest Overfitting
- U.S. CFTC: Understand the Risks of Virtual Currency Trading
- Backtest methodology
Related guides
Open the BTCUSDT research setup
Backtest Trading for iOS
Continue your research on iPhone
Run another setup, inspect every simulated trade, and keep your strategy research close at hand.
Download on the App Store