Article contents
- Evidence and scope
- Illustration
- Process
- What each feature actually measures
- Formulas and information timing
- Separating volatility from volume
- Worked calculations and a misleading case
- How a detector consumes the features
- Testing filters without changing the strategy
- Common pitfalls
- Practical checklist
- Frequently asked questions
- Research sources
Evidence and scope
The core definitions were checked against platform and chart-provider documentation. The combined filter, slope normalization and percentile thresholds below are original research proposals. No new backtest or profit claim is supplied for this indicator combination.
 Open full-size illustration
Practical workflow
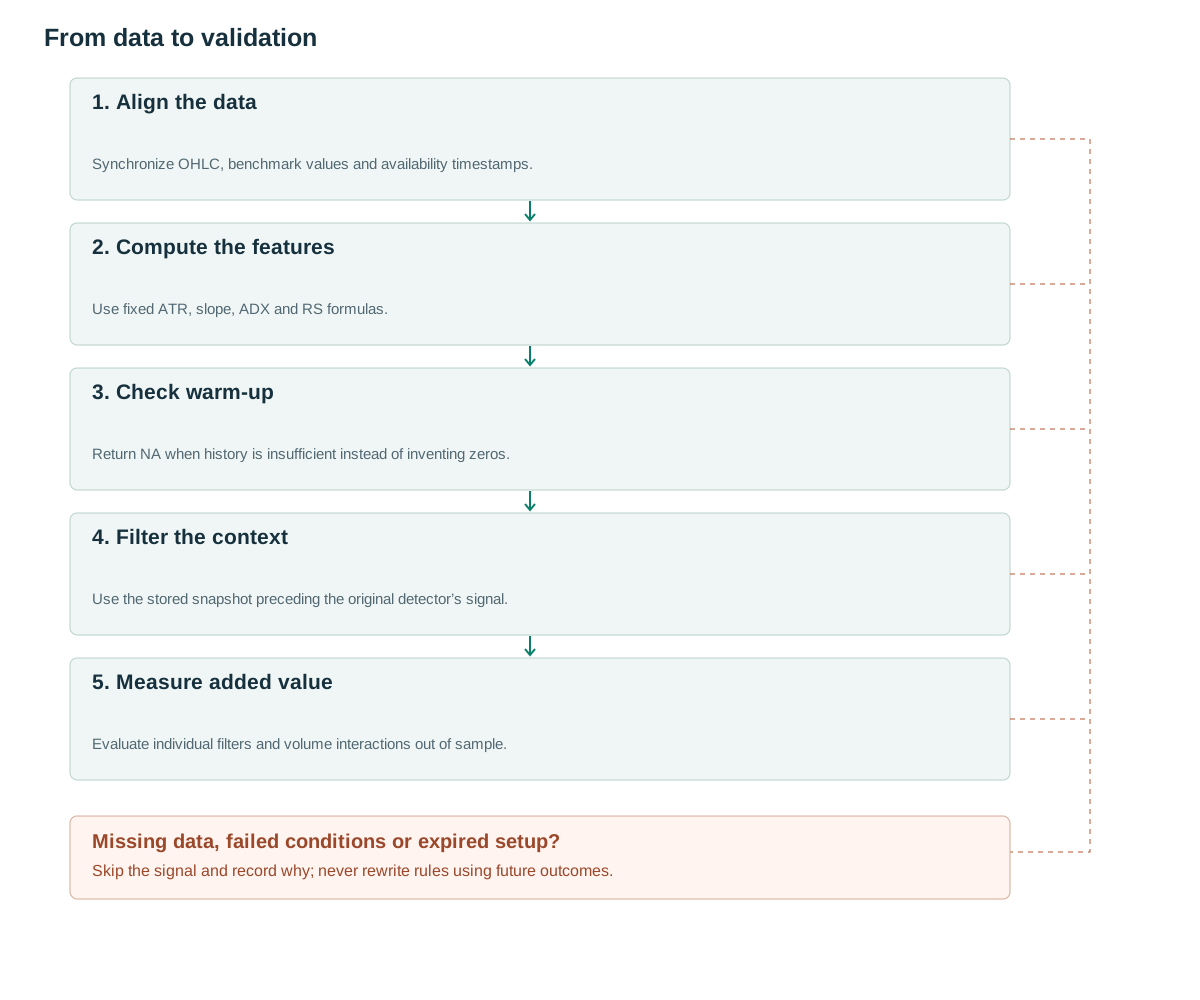
- Align the dataSynchronize OHLC, benchmark values and availability timestamps.
- Compute the featuresUse fixed ATR, slope, ADX and RS formulas.
- Check warm-upReturn NA when history is insufficient instead of inventing zeros.
- Filter the contextUse the stored snapshot preceding the original detector’s signal.
- Measure added valueEvaluate individual filters and volume interactions out of sample.
What each feature actually measures
ATR measures price range including gaps and has no directional sign. [1] ADX measures trend strength, with +DI and −DI adding directional information. [2] Relative strength here means an asset-to-benchmark price ratio. [3] RSI is a different oscillator derived from the asset’s own price changes, not this benchmark comparison.
The features answer separate questions: is a proposed stop large relative to ordinary movement, is the longer-term direction rising or falling, is movement persistent enough to register as a trend, and is the asset outperforming its benchmark? Several favorable readings do not automatically provide independent evidence because the measures share price inputs.
The implementation goal is an immutable context snapshot that an existing detector may consult. Keep the original signal, position-sizing and exit rules intact when testing a filter. Otherwise a stronger result cannot be attributed specifically to the added information.
Formulas and information timing
TR[t]=max(H[t]−L[t],|H[t]−C[t−1]|,|L[t]−C[t−1]|). Seed ATR14 with the mean of the first fourteen valid TR observations, then update ATR[t]=(13ATR[t−1]+TR[t])/14. Proposed normalized ATR is nATR=100ATR/C when C>0. Compare current nATR against the preceding 252 valid observations to calculate pATR; exclude the current observation from that historical set. Return NA when the required history is missing.
The proposed moving-average slope is s=(SMA50[t]−SMA50[t−10])/(10ATR14[t]), measured in ATR units per bar. Return NA for a zero ATR denominator. A positive slope does not guarantee that price is above the average, so retain those as separate features. Percentage change in the average is a different normalization.
For directional movement, UpMove=H[t]−H[t−1] and DownMove=L[t−1]−L[t]. Set +DM=UpMove only when UpMove>DownMove and UpMove>0; otherwise set it to zero. Define −DM symmetrically. Ties set both to zero. Apply Wilder RMA14 to DM and TR; +DI=100RMA(+DM)/ATR, and likewise for −DI. DX=100|+DI−−DI|/(+DI+−DI); ADX=RMA14(DX). Declare the seed and warm-up policy. When both DI values are zero after valid warm-up, use DX=0 in this implementation.
RS[t]=P[t]/B[t], with positive benchmark B. Relative performance over n observations is rel_n=RS[t]/RS[t−n]−1. Do not rank instruments by absolute RS because nominal share prices differ. Join P and B by when their values became available, not merely by a matching date. A later-closing benchmark cannot filter an earlier market’s order.
The proposed long-context filter uses snapshot t−1 for a setup emitted at close t: C>SMA50, slope>0.02, ADX≥20, rel20>0 and pATR between 0.20 and 0.80 inclusive. This one-bar separation is a declared design choice. Using completed close-t features for an order submitted afterward can also be causal, but is a different configuration.
When ATR is zero or unavailable, return NA for DI, DX and ADX in this proposed implementation; do not divide by zero. The DX=0 convention applies only after valid warm-up with positive ATR and both directional components equal to zero.
after close t, save immutable feature snapshot:
  nATR=100*ATR14[t]/C[t]
  pATR=count(past_252_nATR<=nATR)/252
  slope=(SMA50[t]-SMA50[t-10])/(10*ATR14[t])
  rel20=(P[t]/B[t])/(P[t-20]/B[t-20])-1
# Proposed LONG filter: use snapshot t-1 for a setup emitted at close t.
context_ok = C[t-1]>SMA50[t-1] and slope[t-1]>0.02
context_ok &= ADX14[t-1]>=20 and rel20[t-1]>0
context_ok &= 0.20<=pATR[t-1]<=0.80
# The filter enables the original detector; it does not submit orders.
Separating volatility from volume
ATR and ADX do not measure traded volume. When adding RVOL to a breakout, hold the volatility and trend context constant to estimate volume’s incremental contribution. A single news event may increase both ATR and volume; agreement between features need not represent independent sources of information.
A compact experiment starts with the price detector, adds each context feature separately, and then tests interaction with RVOL. If the pATR filter excludes news sessions and large successful breakouts together, report the reduction in drawdown alongside missed profits and reduced opportunity coverage.
Make the missing-data policy explicit for the combined model. A valid ATR alongside missing RVOL does not imply zero activity, and a missing benchmark does not imply neutral relative strength. Track unavailable feature rows separately from rows rejected because a genuinely observed value failed a threshold.
Worked calculations and a misleading case
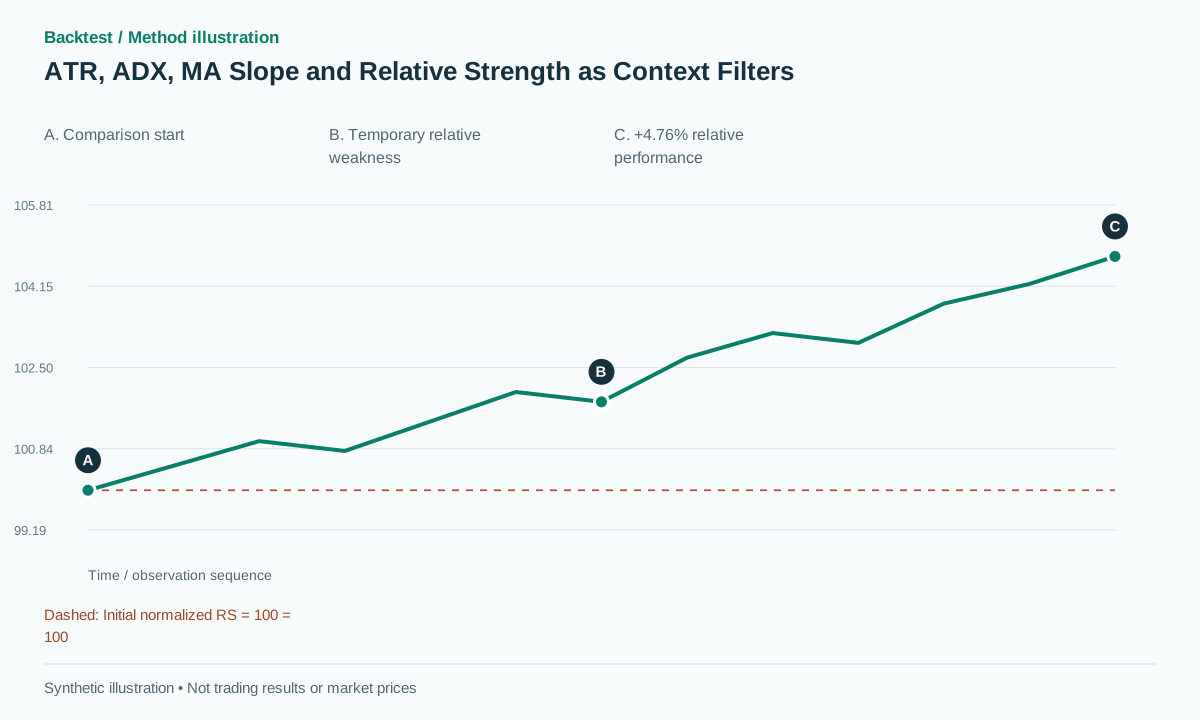
Synthetic example: asset price P rises from 100 to 110 over twenty observations while benchmark B rises from 200 to 210. RS increases from 0.5 to 0.52381, giving rel20=4.7619%. This differs from subtracting returns, which gives five percentage points. With ATR=2.5, nATR is approximately 2.273%.
SMA50 rises from 103 to 105 over ten bars, so slope=2/(10×2.5)=0.08 ATR per bar. If ADX=28, pATR=0.60 and C=110>SMA50=105, the proposed context filter passes. For a signal at close t, these values must belong to the declared t−1 snapshot, not to a later observation selected because it looks favorable.
A misleading case has P falling from 100 to 95 while B falls from 200 to 180. Relative performance is +5.5556% even though the asset loses 5% in absolute terms. If SMA50=100 and slope is negative, the proposed long filter rejects it. A high ADX during a strong decline also does not create a buy signal.
These are formula and logic checks, not profitable and losing historical trades. The indicator chart normalizes RS to an initial value of 100; it can rise while the asset’s own price falls. Its zero volume array means volume is not applicable to that drawing, not that trading activity was zero.
How a detector consumes the features
This feature set has no independent entry, protective stop or exit. When connected to a double bottom, VCP or breakout detector, preserve that detector’s trade rules; the filter only decides whether its context is eligible. Introducing a 2ATR stop creates an additional strategy decision that requires its own comparison.
Data alignment matters more than adding another indicator. Store timezone, exchange session, updated_at, feed delay and the as-of join rule. Do not forward-fill a benchmark indefinitely through mismatched holidays. Set an explicit staleness limit, and determine whether stale observations reject a candidate or mark it unavailable.
For long-horizon relative strength, choose price return or total return consistently. Mixing an asset adjusted for dividends with a benchmark that excludes them changes the comparison. Currency conversion must use rates available at the decision time. On nonpositive futures prices, ATR/C is not the stated measure; a tick- or contract-scaled alternative needs a distinct definition.
Testing filters without changing the strategy
Compare a single baseline with each filter while holding costs and sizing constant. Report trade count, net expectancy, drawdown and coverage by market regime. ADX20, slope0.02 and the twentieth-to-eightieth percentile band are proposed parameters. Select them on a development sample and freeze them before the final evaluation.
Check the library’s ATR and ADX against hand-calculated sequences containing gaps, inside bars, tied directional moves and warm-up boundaries. Different seeds can materially change early observations. Extending a data series with future bars must not alter features already emitted for its earlier prefix.
For RS, test assets and benchmarks whose markets close at different times. Include holiday mismatches, a stale benchmark value, a currency conversion and a missing denominator. For pATR, test ties and verify the stated less-than-or-equal ranking convention. Sensitivity analysis should vary a small predeclared grid, not search indefinitely until one combination appears profitable.
Common pitfalls
Positive relative strength treated as a rising price
An asset can outperform a benchmark simply by falling less.
Overlapping indicators counted as independent evidence
Moving-average slope, ADX and momentum may describe the same underlying price move.
A benchmark that closes later
A same-date close can still be unavailable at decision time and create look-ahead bias.
Checklist before using this method
Check each item after verifying it on your data. Progress is saved in this browser; it does not certify a profitable strategy.
Frequently asked questions
Can normalized ATR be used when futures prices are negative?
Not with the ATR/C definition here. Use a separately defined tick or contract-scale measure; taking an absolute denominator does not preserve exactly the same interpretation.
Is this relative strength the IBD RS Rating?
No. It is a price ratio to a chosen benchmark and its change over time. A proprietary rating or cross-sectional universe percentile is a different measure.
Research sources
Each source supports the definition or evidence described beside it. The pseudocode, synthetic examples and proposed parameters require separate validation.
- Average True Range — TradingViewTradingView. True Range formula, smoothing and the interpretation of volatility. Checked: .
- Average Directional Index — TradingViewTradingView. ADX and directional-movement components; does not establish an edge for the proposed filter. Checked: .
- Price Relative / Relative Strength — ChartSchoolStockCharts. Asset-to-benchmark price ratio; source example charts are not reproduced. Checked: .
Related methods
Risk note
This content supports education and research design, not financial advice. Backtest is historical simulation, does not guarantee future performance and does not place real trades. Methods in this library are not automatically features available in the app. See methodology and learning center.
Validate rules before risking real capital
Check app support, data and individual simulated trades; advanced detectors may require a separate implementation.
Download Backtest on the App Store