Article contents
- Evidence and scope
- Illustration
- Process
- What the public sources establish
- A proposed causal flat-base specification
- Separate activity inside the base from activity at breakout
- Synthetic examples and a failed trade
- Execution and portfolio constraints
- Testing which components contribute
- Common pitfalls
- Practical checklist
- Frequently asked questions
- Research sources
Evidence and scope
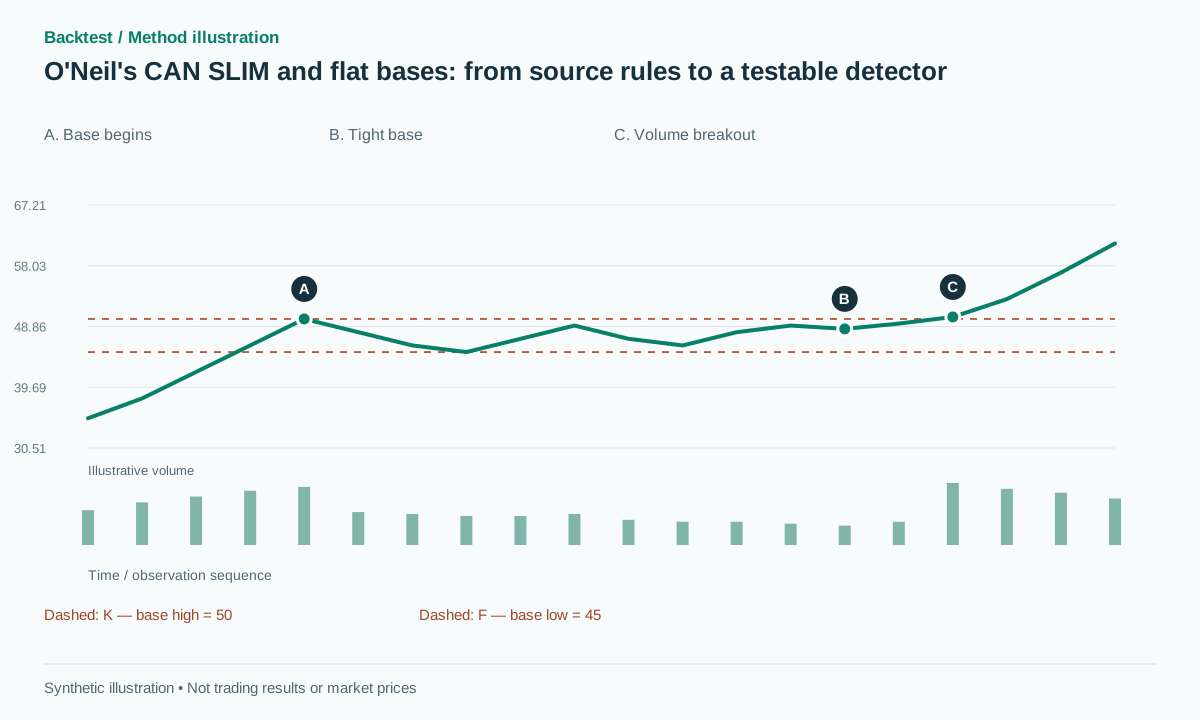
The public IBD booklet and publisher book information were checked. Selected charts of winning stocks are not a complete portfolio trade log. The algorithm below is a proposed flat-base-like research configuration, not a full reproduction of CAN SLIM. No new backtest has been run.
 Open full-size illustration
Practical workflow
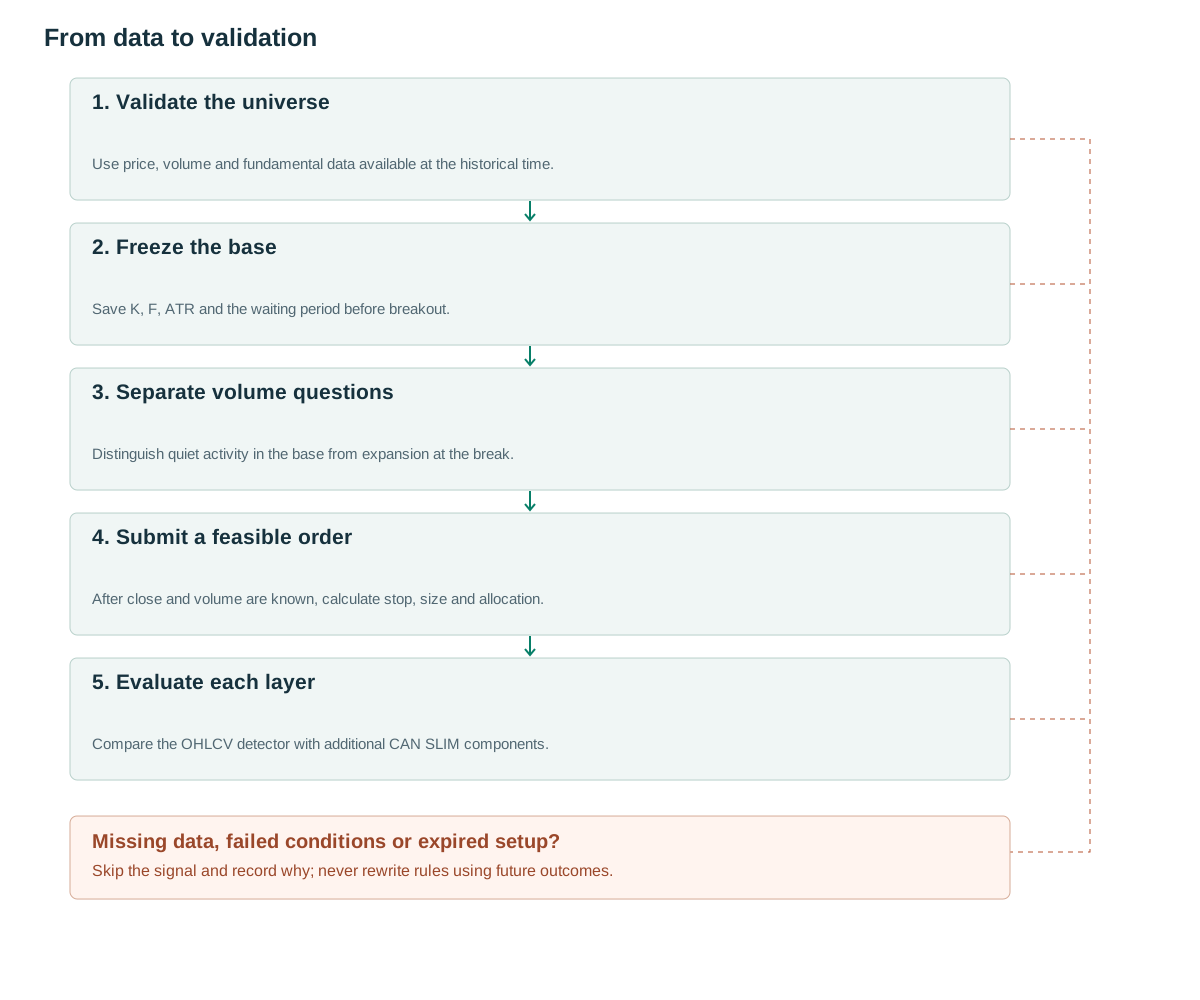
- Validate the universeUse price, volume and fundamental data available at the historical time.
- Freeze the baseSave K, F, ATR and the waiting period before breakout.
- Separate volume questionsDistinguish quiet activity in the base from expansion at the break.
- Submit a feasible orderAfter close and volume are known, calculate stop, size and allocation.
- Evaluate each layerCompare the OHLCV detector with additional CAN SLIM components.
What the public sources establish
The IBD booklet describes a flat base lasting at least five weeks with a correction no deeper than 15%. Its traditional buy point is 10 cents above the base high, with volume roughly 40–50% above the preceding 50-day average. [1] Those are stock-market teaching rules, not universal constants for every asset class.
William J. O'Neil's How to Make Money in Stocks organizes CAN SLIM around quarterly earnings, annual earnings, new developments, supply and demand, leadership, institutional sponsorship and market direction. [2] An OHLCV scanner measures only part of that framework. A result produced without the remaining data should not be labeled a complete CAN SLIM backtest.
This distinction makes the research more informative. A price-volume detector can establish whether a base definition is reproducible and economically tradable. Additional company or market information can then be tested as separate filters. If everything is combined at once, it is difficult to tell whether an apparent benefit comes from the chart pattern, the stock universe, the market filter or a particular exit policy.
A proposed causal flat-base specification
At the close of candidate bar c, inspect the 25 sessions ending at c. Let K be their maximum high, F their minimum low, and depth=(K−F)/K. Require depth≤0.15. The proposed trend proxy is C[c]>SMA200[c] together with SMA200[c]>SMA200[c−20]. The fixed window, moving-average proxy and volatility buffer below are research choices rather than a claim to reproduce every book rule.
Freeze K,F,A=ATR14[c] and b=max(2 ticks,0.1A) when the candidate is created. During the following ten sessions, accept a close crossing above K+b only when RVOL50=V[t]/mean(V[t−50..t−1]) is at least 1.5. Cancel an untraded candidate if price falls below F−b or its waiting period expires. The breakout bar must not be inserted into the frozen base and thereby raise its own resistance level.
If fundamental filters are added, use the timestamp at which a report became available. The end of an accounting quarter is not the date its results were known. Restated EPS, current industry classifications and a universe containing only today’s surviving stocks can all introduce information that was unavailable at the historical decision time.
The data record should therefore contain a value, an observation period and an available-at timestamp for each fundamental field. A candidate can be evaluated only with the latest record available by its decision time. Missing information should remain missing or trigger a declared exclusion rule; it must not be silently filled with a later financial statement.
on close c with no active candidate:
  K=max(H[c-24:c]); F=min(L[c-24:c])  # inclusive
  if depth<=0.15 and trend_proxy: freeze K,F,A,b,expiry=c+10
for c<t<=expiry:
  if L[t]<F-b: cancel
  elif C[t-1]<=K+b and C[t]>K+b and RVOL50[t]>=1.5:
    signal LONG; stop=F-b; enter next executable event
# Comparison baseline: target=entry+2*(entry-stop), time-stop=20 sessions.
Separate activity inside the base from activity at breakout
Volume has two possible jobs: identifying reduced activity in the base and identifying increased activity when resistance breaks. The baseline uses only breakout RVOL. A separate dry-up experiment adds mean volume in the final five sessions before candidate creation divided by mean volume in the preceding 50 sessions, with a proposed maximum of 0.75. This is an added research parameter, not a complete rule set taken from the book.
The final daily volume is known only after the session ends. [3] Do not use that final RVOL to simulate an entry earlier in the same session at the first crossing. An intraday version requires cumulative volume observed at the actual decision time and a comparable expected-volume baseline for that time of day.
Test the dry-up and expansion conditions independently. They can select quite different stocks: a quiet base may break on ordinary volume, while a very active base may produce a high-volume breakout. Keeping both continuous measurements in the dataset is more informative than storing only a combined pass/fail flag. It also allows sensitivity checks around the proposed thresholds without rebuilding the price candidates.
Synthetic examples and a failed trade
Suppose K=50, F=45, depth=10%, A=1 and b=0.1, and the trend proxy passes. After the base has been frozen, price closes at 50.3 with 1.8 million shares traded against a one-million-share average, giving RVOL=1.8. An executable entry at 50.4 and stop at 44.9 imply R=5.5 per share. A proposed 2R target is 61.4. With a hypothetical risk budget of 550 monetary units, the preliminary size is 100 shares before costs, notional limits and liquidity constraints.
A filter-failure case has the same closing price but RVOL=1.1. The volume-filtered version does not enter, while the price-only control may do so. A trading-failure case occurs after entry at 50.4: a gap causes the protective stop to fill at 44.5. The loss is 5.9 per share rather than the planned 5.5. That trade cannot be removed because the base later appears insufficiently attractive.
For a successful synthetic path, price reaches 61.4 before either the protective stop or the 20-session time limit. That path demonstrates how the stated exit would be accounted for; it does not estimate how frequently such a path occurs. The filtered and unfiltered branches must each retain their own actual opportunity set, including candidates that never produce a trade.
Execution and portfolio constraints
A stop outside the entire base is simple for an initial experiment. A stop under a smaller low near the right edge is a separate implementation and can produce a very different distribution of stopped trades. Neither this proposed structural stop nor the 2R/20-session exit should be attributed to O’Neil as a complete original risk-management policy.
After confirmation, observe an available executable quote before submitting a new order. If that price creates an invalid stop relationship or violates a predefined risk limit, record a pre-submission rejection. Once an order has filled, later gap information cannot cancel it retrospectively. If stop and target are both inside one OHLC bar, resolve their ordering with finer data or a conservative rule applied consistently.
Multiple stocks can break out together. A portfolio needs a ranking and allocation policy established before their outcomes are known: liquidity limits, per-name risk, sector concentration, correlated exposure and total notional capacity. A backtest cannot purchase every qualifying stock with an unlimited pool of capital. Record candidates denied allocation so that selection effects remain visible.
Testing which components contribute
Start with the same price-candidate set and compare no volume filter, dry-up only, expansion only, and both conditions. Next, add earnings, relative-strength and broad-market filters one group at a time. Keep entry timing, exits, sizing and costs unchanged when measuring the incremental effect of a filter. Changing the exit simultaneously does not isolate the contribution of volume.
Use a point-in-time universe that includes delisted names where the research question requires them. Report candidate counts, fills, net expectancy in R, portfolio return, drawdown, turnover and holding time. A list of stocks that eventually rose several hundred percent supplies no denominator from which to estimate a trading win rate.
Useful implementation checks include a holiday-shortened week, a split inside the base, a volume spike on the breakout day, an earnings release after the market close, and a gap above resistance before the next order decision. Freeze historical candidates and replay the same prefix with additional future data. Neither the original levels nor the data available at the decision should change.
Common pitfalls
Treating one pattern as the whole system
A flat base does not contain the company and broad-market components of CAN SLIM.
Using end-of-day volume at the start of the day
That is look-ahead. Entry timing must respect when the volume observation becomes available.
Selecting only surviving stocks
Omitting bankrupt or delisted names can inflate historical results and misrepresent the available universe.
Checklist before using this method
Check each item after verifying it on your data. Progress is saved in this browser; it does not certify a profitable strategy.
Frequently asked questions
Should the traditional 10-cent buffer be used in every market?
Not automatically. Tick size and nominal price differ. An ATR-based buffer is a separate research variant and should be labeled and tested as such.
Does RVOL of 1.5 establish profitability?
No. It is one condition in a complete strategy. Its value must be measured after costs and out of sample against the same strategy without that filter.
Research sources
Each source supports the definition or evidence described beside it. The pseudocode, synthetic examples and proposed parameters require separate validation.
- IBD: How To Recognize Great Performing Stocks — Flat BaseInvestor’s Business Daily. Public booklet: flat-base geometry and volume. Selected stock gains are not treated as system returns. Checked: .
- How to Make Money in Stocks, Fourth EditionMcGraw Hill. Publisher metadata and table of contents; the full paid book was not read. Checked: .
- TradingView: RepaintingTradingView. Timing of available data; no profitability validation. Checked: .
Related methods
Risk note
This content supports education and research design, not financial advice. Backtest is historical simulation, does not guarantee future performance and does not place real trades. Methods in this library are not automatically features available in the app. See methodology and learning center.
Validate rules before risking real capital
Check app support, data and individual simulated trades; advanced detectors may require a separate implementation.
Download Backtest on the App Store