Article contents
Evidence and scope
Book metadata and the published description of an author interview were verified. The complete paid book and full audio episode were not reviewed. The classifier below is a proposed quantitative proxy, not a claim to reproduce Weinstein’s complete system or performance.
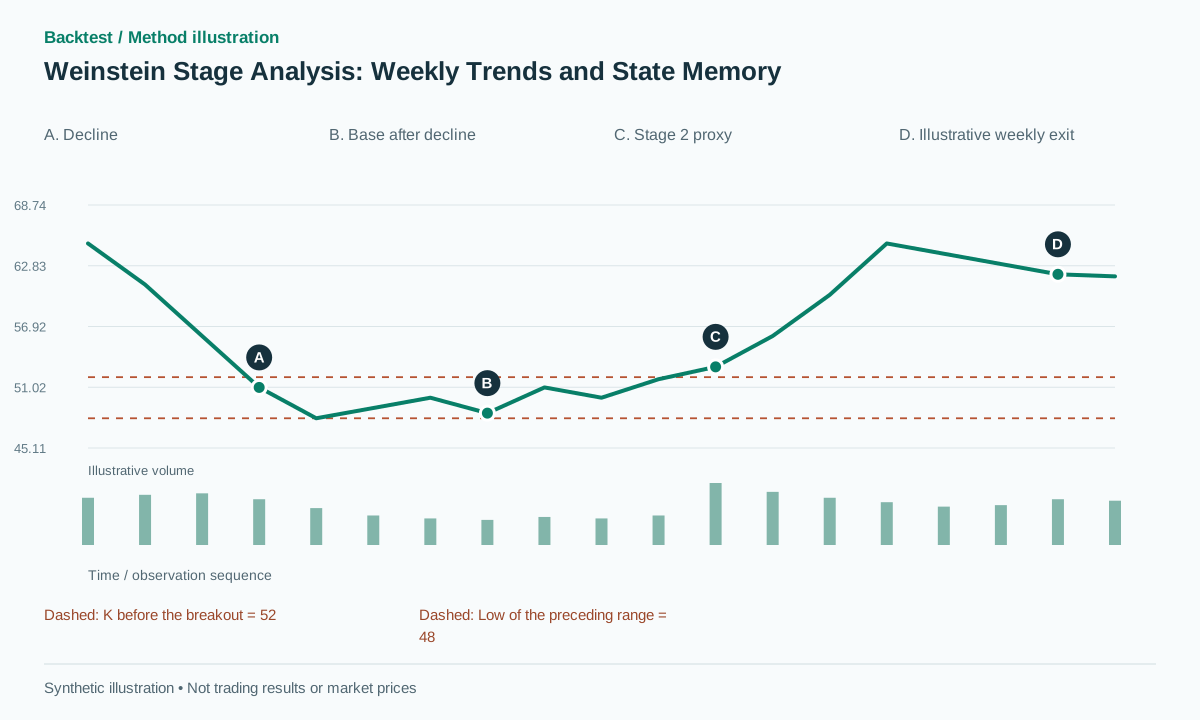 Open full-size illustration
Practical workflow
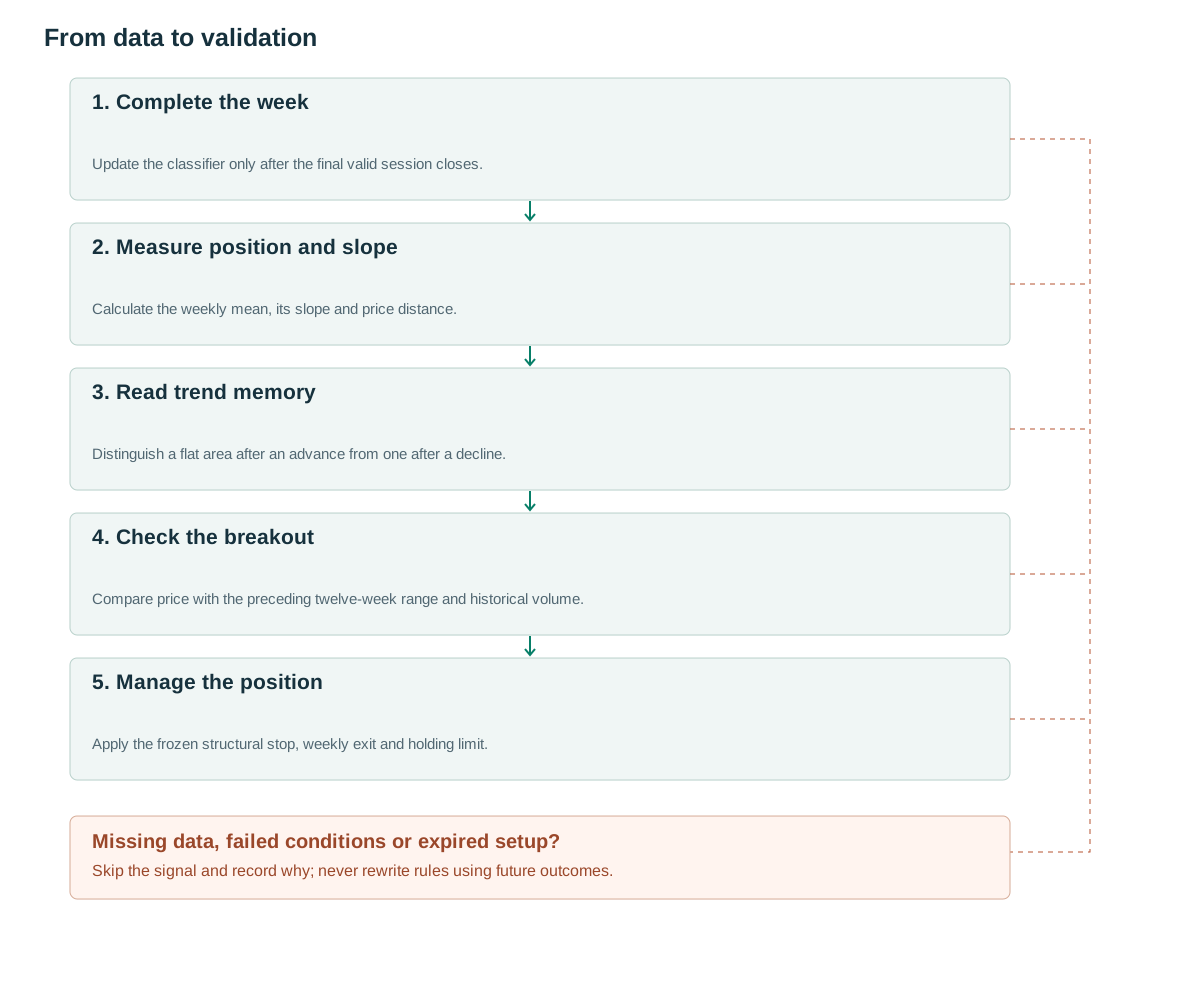
- Complete the weekUpdate the classifier only after the final valid session closes.
- Measure position and slopeCalculate the weekly mean, its slope and price distance.
- Read trend memoryDistinguish a flat area after an advance from one after a decline.
- Check the breakoutCompare price with the preceding twelve-week range and historical volume.
- Manage the positionApply the frozen structural stop, weekly exit and holding limit.
What the structure tells us
Stan Weinstein’s book was published by McGraw-Hill in 1988; the public contents and terminology include stages, buy/sell timing, volume and relative strength. [1] TraderLion’s 2021 interview listing provides an author-interview lead about Stage Analysis. [2] The listing was reviewed, but unverified statements from the audio are not used as evidence here.
The research objective is to distinguish consolidation following a decline from consolidation following an advance, then ask whether buying only in an advancing context improves a simple breakout. The slope, distance and holding thresholds are our own operational choices. A category name should not imply that every discretionary consideration in the original approach has been implemented.
Memory matters because two flat averages can describe different histories. A base after falling prices may represent an attempted recovery, while a flat area after a rise may represent stalling. Neither interpretation guarantees the next direction. The classification supplies context; the entry trigger must still be specified separately.
Rules using information already available
At completed week W, calculate M=SMA30 of weekly closes and s=(M[W]−M[W−4])/M[W−4]. Set proposed thresholds theta=0.005 and band=0.05. Classify UP when C[W]>M[W] and s>theta; DOWN when C[W]<M[W] and s<−theta. Classify FLAT when |s|≤theta and |C/M−1|≤band. Everything else is TRANSITION.
Retain last_trend as the most recent UP or DOWN observation. UP emits stage2_proxy and updates memory; DOWN emits stage4_proxy. FLAT following DOWN emits stage1_proxy, while FLAT following UP emits stage3_proxy. Without prior trend memory, use UNKNOWN. Preserve memory through transition observations rather than forcing each week into one of four labels.
The proposed weekly trigger requires stage2_proxy, C[W]>K+b and C[W−1]≤K+b. K is the highest high of the twelve preceding weeks W−12 through W−1; F is their lowest low. Set A=ATR14_week[W−1] and b=max(2 ticks,0.1A). Require weekly RVOL20≥1.5 against the mean volume of the preceding twenty weeks. Submit an order only after W is complete. [3]
A missing weekly bar is not a zero-volume week. Define the exchange calendar first, then aggregate each valid week. Warm-up must cover every lagged average and slope input before classification is eligible. A shock may move the proxy directly from an advancing to a declining state; an aesthetically tidy sequence is not a requirement.
on weekly close W:
  calculate M,s from completed weeks only
  classify proxy using last_trend memory
  K=max(H[W-12:W-1]); F=min(L[W-12:W-1])  # both endpoints inclusive
  A=ATR14_week[W-1]; b=max(2*tick,0.10*A)
  if stage2_proxy and C[W-1]<=K+b and C[W]>K+b and RVOL20week>=1.5:
    signal LONG; stop=F-b; enter next executable session
after fill:
  keep initial protective stop intraday
  if weekly_C[W]<M[W-1] or holding_weeks>=26: exit next session
Giving volume a specific job
A breakout week’s volume contains the entire week’s trading activity and cannot be known on Monday. Holiday weeks also contain different numbers of sessions. Raw weekly volume and volume per completed session are distinct candidate features and should be evaluated separately. The 1.5 threshold is a research parameter, not a claimed verbatim Weinstein rule.
Relative strength can be added as the ratio of stock price to a benchmark available at the same decision time, followed by a historical slope or return calculation. This is different from RSI. Evaluate market and sector filters separately so that improvements from avoiding weak broad conditions are not misattributed to an individual stock’s stage label.
For cross-market benchmarks, align by availability timestamp rather than a shared date label. A benchmark closing later in the day must not enter an earlier equity decision. Volume, price and the benchmark should also follow consistent holiday and corporate-action conventions.
Numerical examples and failure cases
Synthetic example: M[W−4]=50 and M[W]=50.4, so s=0.8%, exceeding 0.5%. The weekly close is 53, above its average. The preceding twelve weeks have K=52 and F=48; prior weekly ATR is 4, giving b=0.4. The previous close is 51.8 and weekly RVOL is 2.2. The long signal becomes available only after W closes.
An executable entry at 53.2 and stop at 47.6 imply R=5.6 per share. In a synthetic successful path, price reaches 65 and later closes the week at 62, below the preceding-week M of 62.5. A next-session exit at 61.8 earns 8.6 points, approximately 1.54R before costs. The weekly condition does not promise a fill at the weekly close.
The failure path falls immediately and gaps through protection, filling the stop at 47.2 for a loss of 6 points. Another rejected case trades above 52.4 during the week but closes the week at 51. That case produces no signal in this weekly version, even if an unfinished chart briefly displayed a favorable stage and breakout.
Entry, invalidation and exits
The baseline protective stop lies below the preceding twelve-week low because that level is known when the order is decided. If the distance is too large, reduce size or reject the opportunity under a previously defined risk constraint. A closer swing stop or moving-average stop is a different experiment; a future low is never an available substitute.
The proposed exit occurs after a weekly close below the preceding-week M or after 26 holding weeks, with execution in the next feasible session. The initial protective stop remains active intraday. If the stop fills before the weekly decision, the trade is already closed; do not choose the more favorable exit retrospectively.
A 30-week SMA is not a 150-day SMA. Their sampling and time weights differ. A daily trigger combined with weekly context must use the most recent completed week, not the eventual current-week value shown on a historical chart. Record the weekly information timestamp separately from the daily order timestamp.
Testing incremental value
The control is the same twelve-week breakout without the stage filter. Add slope, memory and volume in separate experiments. Determine whether memory changes actionable decisions or merely adds explanatory labels. SMA, EMA and WMA are separate configurations rather than interchangeable implementations.
Report false transitions, classification delay, the fraction of UNKNOWN observations, net returns and drawdown. A filter that avoids a long decline may enter a rapid recovery late. Measure missed opportunities and delayed entries as well as avoided losses. No newly reproduced return series is supplied in this article.
Test calendar edges explicitly: a holiday-shortened week, a missing session, an incomplete live week and a large gap after the weekly signal. A prefix-replay test should show that adding later weeks does not change earlier stage states. Keep classification warm-up outside performance measurement, and retain state across train/test boundaries using only history available before each boundary.
Common pitfalls
Price above a mean treated as a complete Stage 2
This is only part of a context filter and does not include a base, sector conditions or relative strength.
Bases and tops receive the same interpretation
Flat areas need prior-trend memory if their historical context is to remain distinguishable.
Daily and weekly means treated as equivalent
Different sampling creates different signals, weighting and response times.
Checklist before using this method
Check each item after verifying it on your data. Progress is saved in this browser; it does not certify a profitable strategy.
Frequently asked questions
Must the stages always follow 1→2→3→4?
Not in this proxy. Shocks may produce rapid changes, and ambiguous observations remain UNKNOWN or TRANSITION instead of receiving a forced label.
Is Stage Analysis an independent entry signal?
Separate context from the trigger. This article adds a twelve-week breakout to create a concrete strategy that can be compared with a control.
Research sources
Each source supports the definition or evidence described beside it. The pseudocode, synthetic examples and proposed parameters require separate validation.
- Stan Weinstein's Secrets For Profiting in Bull and Bear MarketsMcGraw-Hill Education / Google Books. Public metadata, contents and displayed terminology; not the complete book. Checked: .
- Interview with Stan Weinstein — TraderLion Podcast, Episode 1TraderLion / Apple Podcasts. Published description of the September 10, 2021 interview; unverified audio statements are not used. Checked: .
- TradingView: RepaintingTradingView. Documentation on repainting and information availability; supports the completed-bar timing discipline. Checked: .
Related methods
Risk note
This content supports education and research design, not financial advice. Backtest is historical simulation, does not guarantee future performance and does not place real trades. Methods in this library are not automatically features available in the app. See methodology and learning center.
Validate rules before risking real capital
Check app support, data and individual simulated trades; advanced detectors may require a separate implementation.
Download Backtest on the App Store