Article contents
Evidence and scope
The references include an official book list, a firsthand workshop report and organizer-published account results. Account performance does not isolate VCP or volume. The detector, thresholds and exit policy below are original research proposals; no new backtest has been run.
 Open full-size illustration
Practical workflow
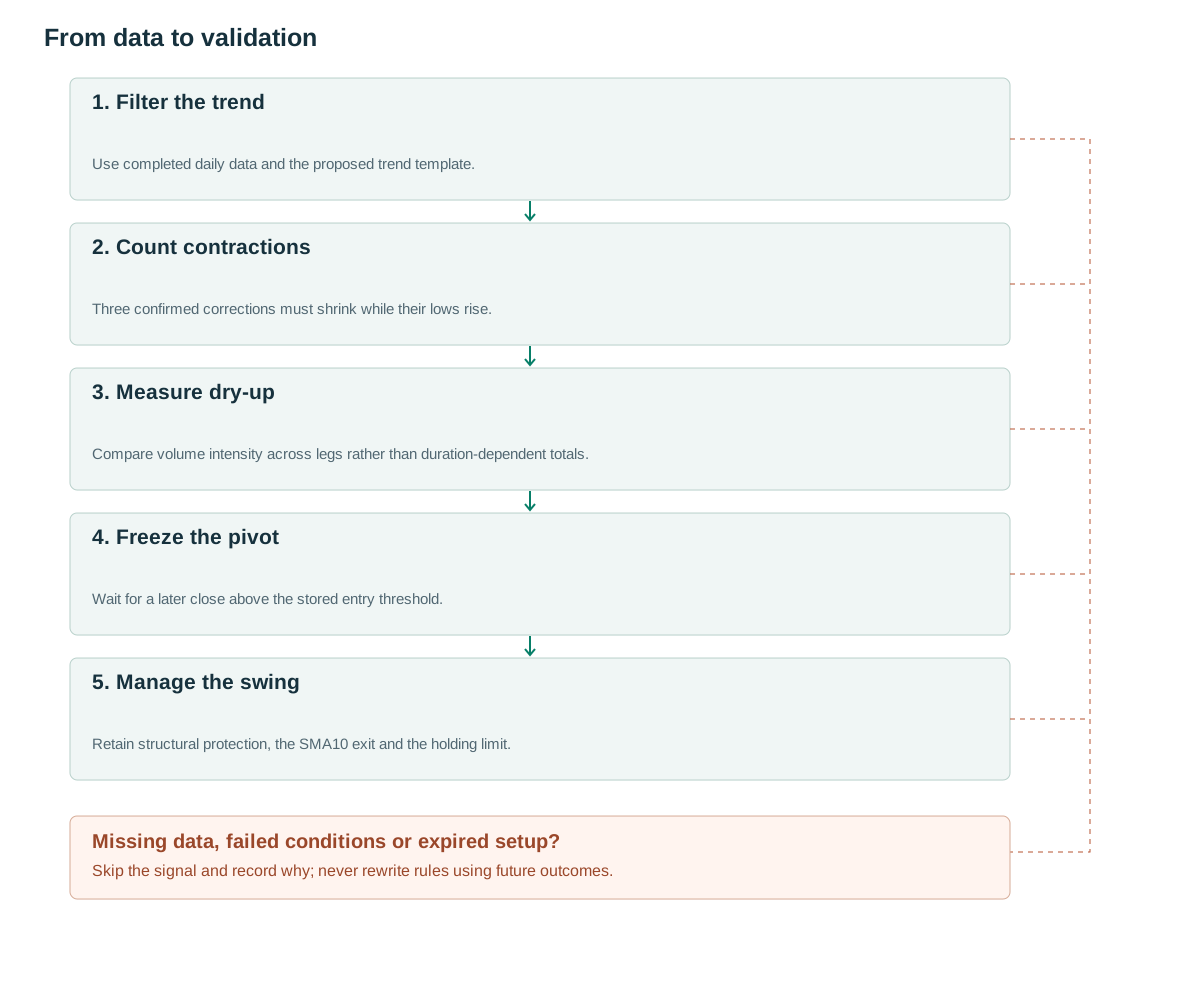
- Filter the trendUse completed daily data and the proposed trend template.
- Count contractionsThree confirmed corrections must shrink while their lows rise.
- Measure dry-upCompare volume intensity across legs rather than duration-dependent totals.
- Freeze the pivotWait for a later close above the stored entry threshold.
- Manage the swingRetain structural protection, the SMA10 exit and the holding limit.
What the structure tells us
A workshop participant describes VCP as tightening toward the right side of a base and expands SEPA as Specific Entry Point Analysis. [1] The official book list includes Trade Like a Stock Market Wizard and Think & Trade Like a Champion. [2] These public materials do not establish that the complete paid books were reviewed.
The organizer lists Minervini at +334.8% for 2021 in Money Manager Verified Ratings, Stock Division, for accounts of at least $1 million. [3] That is an account result over one period. It does not identify the contribution of three contractions, a particular volume threshold or this detector. The listing alone should not be described as an independent audit.
The implementation question is narrower: after a strong trend, does an objectively shrinking sequence of corrections improve the subsequent breakout distribution? The following rules turn that question into a falsifiable experiment. A visually attractive base that cannot be recognized before its breakout is not a usable historical signal.
Rules using information already available
Use a proposed daily trend template: C>SMA50>SMA150>SMA200, with SMA200 above its value twenty sessions earlier. Identify three successive confirmed high-to-low corrections within 15–80 sessions using pivots with three bars on each side. For correction k, define d[k]=(H[k]−L[k])/H[k]. Require d2≤0.8d1, d3≤0.8d2 and L1<L2<L3.
When the third low is confirmed, freeze K=H3, floor=L3, A=ATR14 from the preceding session and b=max(2 ticks,0.1A). Let v[k] be mean volume over the declining leg of correction k. The proposed dry-up filter requires v3/v1≤0.70 and mean volume over the five sessions preceding candidate creation divided by mean volume over the preceding fifty sessions ≤0.75.
Only a later close crossing K+b can trigger. Test an optional RVOL50≥1.5 requirement, with the denominator using the preceding fifty sessions and excluding the signal session. Expire the candidate after ten sessions or cancel it if low<floor−b. Confirmed pivots become available late. [4] A completed ZigZag cannot justify placing an order on the earlier low.
When several pivot sequences overlap, use a deterministic selection policy, such as the most recently confirmed eligible third low, and log rejected alternatives. Store both the time of each extreme and its confirmation time. Appending future bars must not alter the orders previously emitted by a replay of the detector.
when third contraction is confirmed:
  if trend and shrinking_depths and rising_lows and dry_up:
    freeze K=H3, floor=L3, A,b,expiry=now+10
for later close t:
  if L[t]<floor-b or t>expiry: cancel
  elif C[t-1]<=K+b and C[t]>K+b and optional_RVOL_pass:
    emit LONG; stop=floor-b; enter next executable event
after fill:
  retain intraday initial stop
  if C[t]<SMA10[t-1] or holding_days>=40: exit next feasible event
Giving volume a specific job
Dry-up and expansion answer different questions: has trading activity diminished before the break, and does it increase when price crosses the pivot? Run four versions: no volume conditions, dry-up only, expansion only, and both. Do not require volume to fall every day; that would be an additional restriction that can reject an otherwise eligible base because of one event session.
Compare mean volume across legs because their durations differ. A shorter third correction naturally has less total volume even when trading intensity is unchanged. Retain leg length, earnings dates, spread and missing-volume flags as diagnostics. Volume needs a stable unit and session definition throughout the candidate.
A low-volume base can also be an illiquid base. Check quoted or estimated transaction costs separately from the pattern conditions. Never treat missing volume as zero, and do not let a split-induced change in raw share counts masquerade as a sudden expansion in comparable activity.
Numerical examples and failure cases
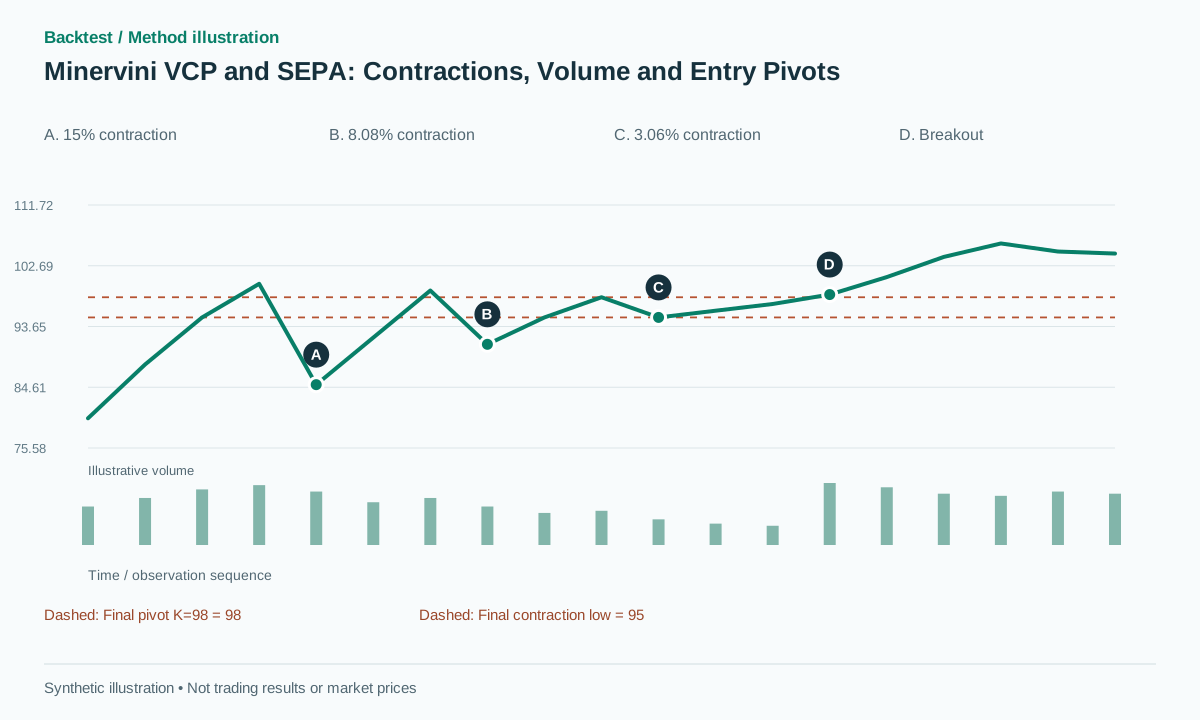
Synthetic example: the three H/L pairs are 100/85, 99/91 and 98/95. Their depths are 15%, 8.08% and 3.06%, satisfying both contraction ratios and rising lows. Mean declining-leg volume is 1.4, 1.0 and 0.7 million, so v3/v1=0.5. Assume the separate five-versus-fifty-session dry-up condition and trend template also pass.
With A=2 and b=0.2, K=98. A later close of 98.4 confirms the price trigger. An executable entry of 98.5 and stop of 94.8 give risk R=3.7 per share. In a synthetic successful path, price reaches 106 and later closes at 104.8 below the preceding-session SMA10 of 105.1. The next feasible exit at 104.5 earns 6 points, approximately 1.62R before costs.
In the failure path, the same entry is followed by a stop fill at 94.7, losing 3.8 points. A final contraction of 9% would instead fail the geometry before entry. Do not relabel its anchors afterward to obtain a passing example. These scenarios illustrate arithmetic and event sequencing, not observed frequency or profitability.
Entry, invalidation and exits
This daily swing baseline has no fixed 2R profit target. Keep the initial protective stop active intraday; exit after a close below the preceding-session SMA10 or after forty holding sessions, using the next feasible execution event. This is the research project’s baseline, not an attributed Minervini exit rule. A 2R target can be tested as a separate exit experiment.
A very tight base may create a stop distance that is small relative to spread, fees and ordinary noise. Size from the actual entry-to-stop risk and impose additional caps on notional exposure, liquidity and sector concentration. A gap through the stop can lose more than 1R. Do not replace its fill with the intended trigger price.
If entry gaps sharply above K, use the predeclared affordability and risk checks before submitting an unfilled order. If an already live order fills unfavorably, retain that fill and any subsequent reduction cost. Switching from close confirmation to a resting intrabar entry order changes both information timing and the required data.
Testing incremental value
The first control is a breakout under the same trend template without a contraction requirement. Add three-leg geometry, rising lows, dry-up and expansion one at a time. Keep candidate handling, entry, exit, sizing and costs consistent, so any observed change can be assigned to the feature being tested.
Use chronological out-of-sample evaluation, include delisted stocks and respect portfolio capital limits. Report candidate counts, waiting times, executed trades, net expectancy in R, drawdown and sensitivity to the 0.8 and 0.7 ratios. Sparse samples require uncertainty intervals rather than a seemingly precise win rate.
Useful deterministic tests include equal-depth corrections that fail strict shrinking, a third pivot confirmed after the apparent breakout, missing volume within a leg, expiry on the boundary session and a stop gap. Replaying the same prefix twice must produce identical candidate identifiers and frozen pivots. The author’s account record cannot substitute for these checks.
Common pitfalls
Account returns treated as detector returns
An account combines selection, timing and management; its result does not isolate VCP.
A ZigZag that uses future bars
A correction endpoint is usable only after confirmation, even when the chart plots it on the earlier extreme.
Tight but impractical risk
Spread and noise can overwhelm a tiny stop distance and undermine the theoretical reward-to-risk ratio.
Checklist before using this method
Check each item after verifying it on your data. Progress is saved in this browser; it does not certify a profitable strategy.
Frequently asked questions
Must VCP contain exactly three contractions?
No such universal rule is asserted here. Three is a specific proposed configuration that makes the initial experiment reproducible.
Why not use a target equal to the base height?
This article evaluates a swing held under an SMA10 exit. A geometric target is a different hypothesis and should be compared on the same entry set.
Research sources
Each source supports the definition or evidence described beside it. The pseudocode, synthetic examples and proposed parameters require separate validation.
- 2020 Master Trader Program: Superperformance Workshop With Mark MinerviniLeslie N. Masonson / Stocks & Commodities; hosted on Minervini’s CDN. Firsthand workshop report discussing VCP and SEPA; not the full text of a book. Checked: .
- Books — Mark MinerviniMinervini Private Access. Official book catalogue, including Trade Like a Stock Market Wizard and Think & Trade Like a Champion. Checked: .
- December 31, 2021 StandingsFinancial Competitions. Money Manager Verified Ratings for accounts of at least $1 million; not a transaction log or an audit confirmation. Checked: .
- TradingView: RepaintingTradingView. Documentation on repainting and historical versus realtime information; methodological context for confirmation timing. Checked: .
Related methods
Risk note
This content supports education and research design, not financial advice. Backtest is historical simulation, does not guarantee future performance and does not place real trades. Methods in this library are not automatically features available in the app. See methodology and learning center.
Validate rules before risking real capital
Check app support, data and individual simulated trades; advanced detectors may require a separate implementation.
Download Backtest on the App Store