Article contents
Evidence and scope
The cited material supports terminology and research context. The numerical thresholds, state machine, execution policy and synthetic examples below are proposed by this research project. No new backtest has been run, and the references do not establish profitability for this configuration.
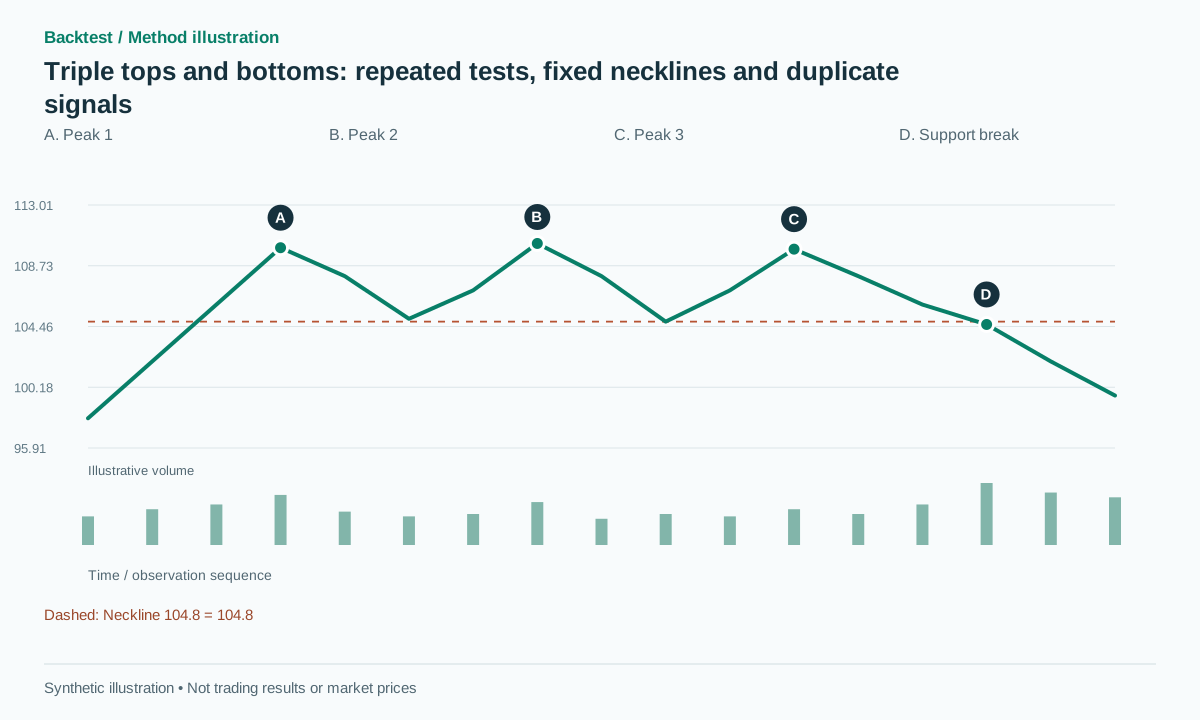 Open full-size illustration
Practical workflow
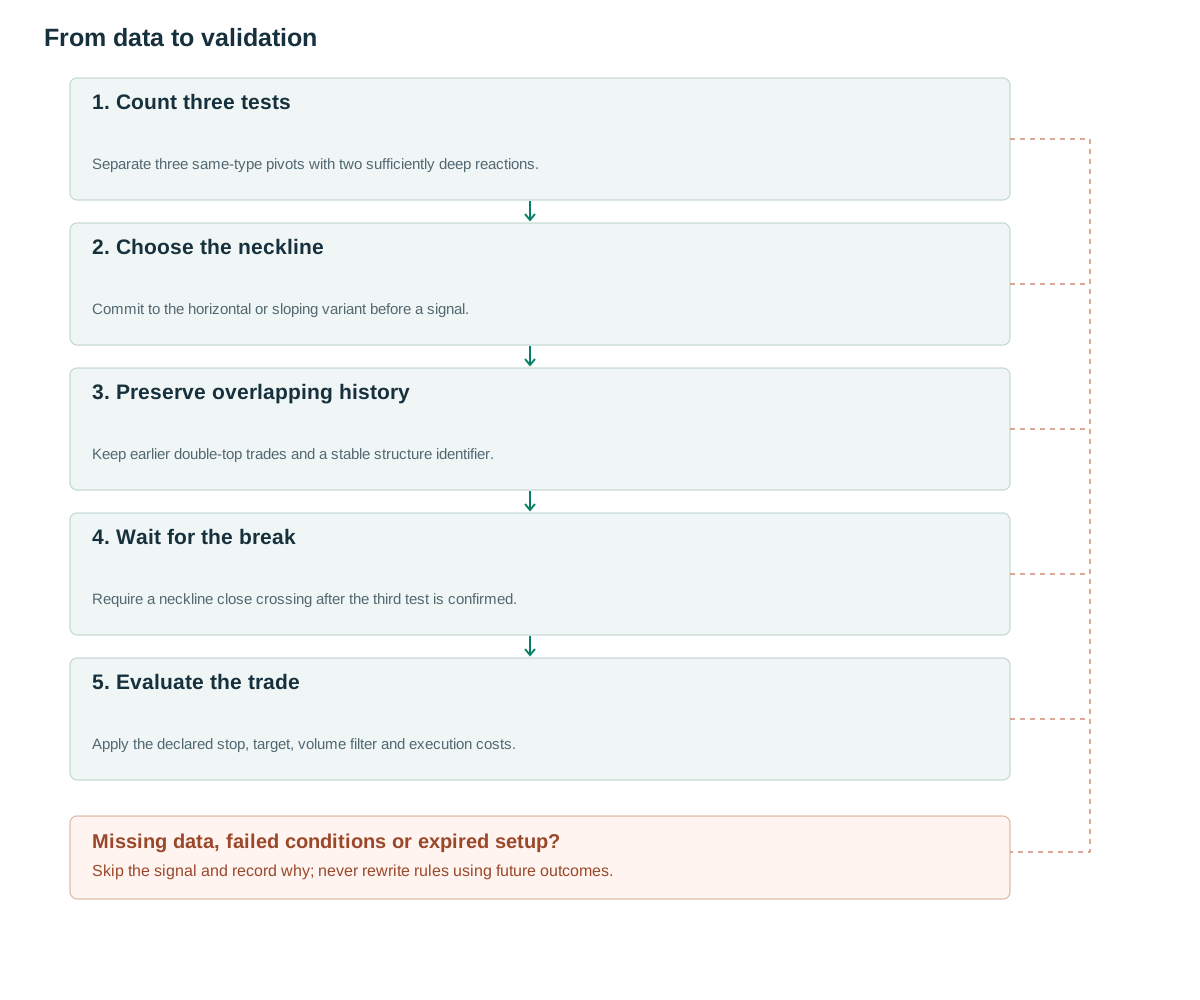
- Count three testsSeparate three same-type pivots with two sufficiently deep reactions.
- Choose the necklineCommit to the horizontal or sloping variant before a signal.
- Preserve overlapping historyKeep earlier double-top trades and a stable structure identifier.
- Wait for the breakRequire a neckline close crossing after the third test is confirmed.
- Evaluate the tradeApply the declared stop, target, volume filter and execution costs.
What the structure tells us
Triple tops and bottoms involve three tests of a resistance or support area before a reversal. [1] Their geometry can overlap with a rectangle. The preceding trend and eventual exit direction distinguish a reversal interpretation from a generic range description.
Three touches do not prove that a large seller or buyer appeared three times. OHLC does not identify participant intent. The structure becomes useful for research when it defines a measurable confirmation level, invalidation level and time window. A substantially higher third high should usually be classified differently rather than accommodated by widening the tolerance after the fact.
A repeated test can also create a sequence of related candidates. The first two highs may have qualified as a double top before the third high existed. The dataset should preserve that history. Otherwise the most successful final label can replace an earlier losing trade, creating an unrealistically clean record.
Rules using information already available
Proposed settings: use three bars on each side to confirm pivots, forming H1,L1,H2,L2,H3 in chronological order. Freeze A=ATR(14) when H3 becomes available, epsilon=max(2 ticks,0.15A), and breakout buffer b=max(2 ticks,0.10A). Define N=min(L1,L2) and D=median(H1,H2,H3)−N. Require D≥1.5A and max(H1,H2,H3)−min(H1,H2,H3)≤max(2epsilon,0.1D).
Each pullback between adjacent highs and lows must be at least A deep, and successive highs must be at least seven bars apart. Using the lower of the two intervening lows creates a conservative horizontal neckline. A line joining those lows is a different variant. Do not choose whichever neckline produces the preferred historical entry for each chart.
Every pivot becomes usable only at its confirmation time. [2] If the first two highs already produced a double-top trade, the third high cannot revise that trade. Assign a stable structure identifier, preserve the earlier signal and let the portfolio policy decide whether another trade in the same region is allowed.
After candidate creation, seek the first close crossing below N−b. Expire after half the pattern duration, rounded upward, with a minimum of five bars. Invalidate a short candidate if price exceeds the highest peak plus epsilon. For triple bottoms, reverse the extreme types and inequalities; the horizontal neckline is the higher intervening high.
when H3 is confirmed:
  if alternating(H1,L1,H2,L2,H3) and geometry_valid:
    N=min(L1,L2); D=median(H1,H2,H3)-N
    freeze(candidate, N, D, stop=max(H1,H2,H3)+epsilon)
for each later closed bar t:
  if High[t] > stop or t > expiry: cancel
  elif Close[t-1] >= N-b and Close[t] < N-b: signal SHORT
# Triple bottoms reverse the extremes and inequalities.
# expiry=created+max(5,ceil(duration/2)).
Giving volume a specific job
One testable hypothesis is that median volume around the three peak regions declines, followed by breakout RVOL of at least 1.5. Use equally sized windows and only observations already available. Do not require volume to decline perfectly on every bar: that creates a much rarer condition and can overfit a few visually tidy examples.
Compare three versions: price only, breakout volume only, and the complete three-peak volume sequence plus breakout volume. If the complete filter removes most opportunities without improving net out-of-sample outcomes, its added complexity has not been justified. Keep tick volume and traded-contract volume in separate datasets.
Store the individual measurements as well as the final filter decision. A monotonically declining sequence may fail because the middle test contains a single news bar, while the average activity remains low. Continuous features allow that sensitivity to be examined without changing the original price candidates.
Numerical examples and failure cases
Synthetic example: highs are 110,110.3,109.9 and intervening lows are 105,104.8, with A=1. The median high is 110, so D=5.2 and the height tolerance is 0.52. The highs span only 0.4 and pass. N=104.8; a close at 104.6 crosses below the 104.7 trigger threshold. A feasible short at 104.5, stop at 110.45 and target at 99.6 offer reward of 4.9 against risk of 5.95, only 0.82R before costs. A third test does not make poor reward-to-risk acceptable.
Failure example: price reaches 104.9 without a qualifying close below the threshold, then rebounds to 111. That is an invalidated candidate, not a losing trade in this close-confirmed version. In another path, a short entered after the valid close at 104.6 later rebounds to 110.5. Record the actual stop fill and loss even though the original geometry was valid.
A useful boundary test changes only the third high from 109.9 to 110.6. The median high becomes 110.3, D becomes 5.5 and the tolerance becomes 0.55. The three-high spread of 0.6 still exceeds that recalculated tolerance. The detector should reject it without shifting the first high, choosing a different median window or widening the rule. This is a recognition test, not a statement about whether the rejected structure will subsequently fall.
Entry, invalidation and exits
The baseline protective stop sits above the highest peak plus epsilon. A stop just above H3 can reduce the planned risk but may be more vulnerable to noise; test it as a separate version. Freeze the short target at N−D. For triple bottoms, use the lower trough for structural protection and project upward from the higher intervening high.
Enter at the next feasible event after the confirming close. A retest variant can instead require contact with N±epsilon followed by a close back below N, but it needs a fixed waiting period. Do not assume that every breakout returns to the neckline. Keep an already-filled trade in the ledger even if another high later forms.
If several detectors describe the same range, use a shared opportunity identifier. Portfolio rules may permit only one position, allow a new trade only after the first is flat, or allocate a combined risk budget. Each policy is testable; silently counting one market move as several independent wins is not. Gap fills, spread and short-borrow constraints remain part of execution.
Testing incremental value
The direct control is a double-top strategy using the same context filter and exit policy. Measure whether waiting for a third test improves outcomes enough to compensate for later entry and fewer opportunities. Report candidates, confirmation rate, net expectancy and time with capital committed, rather than only completed-pattern success.
Split data by time and group overlapping structures so that related windows do not appear as independent examples on both sides of a train/test boundary. Test nearby tolerances without choosing a single setting that happens to match a handful of attractive charts. The methodological reference [3] does not provide results for this proposed configuration.
Replay checks should include three distinct tests, several adjacent bars mistakenly counted as separate tests, an earlier double-top loss followed by a successful triple top, and a third high confirmed after the neckline already broke. The historical double-top result must remain unchanged. The late-confirmed triple candidate must not receive an entry before it existed.
Common pitfalls
Assuming three tests are automatically stronger
That is an empirical hypothesis, not a guaranteed relationship.
Counting bars instead of distinct attempts
Several adjacent bars near the same high may represent one pivot cluster rather than three independent tests.
Changing the neckline after seeing the move
Switching from the lower intervening low to the higher one can manufacture a more favorable historical signal.
Checklist before using this method
Check each item after verifying it on your data. Progress is saved in this browser; it does not certify a profitable strategy.
Frequently asked questions
How does a triple top differ from a rectangle?
The geometry can overlap. Calling it an uptrend reversal requires an earlier uptrend. Two names should not turn one market opportunity into two independent trades.
Must volume fall across all three peaks?
Treat that as a separate experimental filter. The idealized description does not justify discarding every other volume path without testing it.
Research sources
Each source supports the definition or evidence described beside it. The pseudocode, synthetic examples and proposed parameters require separate validation.
- IG Academy: Basic chart patterns part oneIG. Basic triple-top and triple-bottom terminology; the relevant public section was read. Checked: .
- TradingView: RepaintingTradingView. Pivot confirmation delay and repainting. Checked: .
- Lo, Mamaysky, Wang: Foundations of Technical AnalysisNBER / Columbia University. Background on systematic pattern research; this configuration is not tested by the paper. Checked: .
Related methods
Risk note
This content supports education and research design, not financial advice. Backtest is historical simulation, does not guarantee future performance and does not place real trades. Methods in this library are not automatically features available in the app. See methodology and learning center.
Validate rules before risking real capital
Check app support, data and individual simulated trades; advanced detectors may require a separate implementation.
Download Backtest on the App Store