Article contents
Evidence and scope
The cited material supports terminology and research context. The numerical thresholds, state machine, execution policy and synthetic examples below are proposed by this research project. No new backtest has been run, and the references do not establish profitability for this configuration.
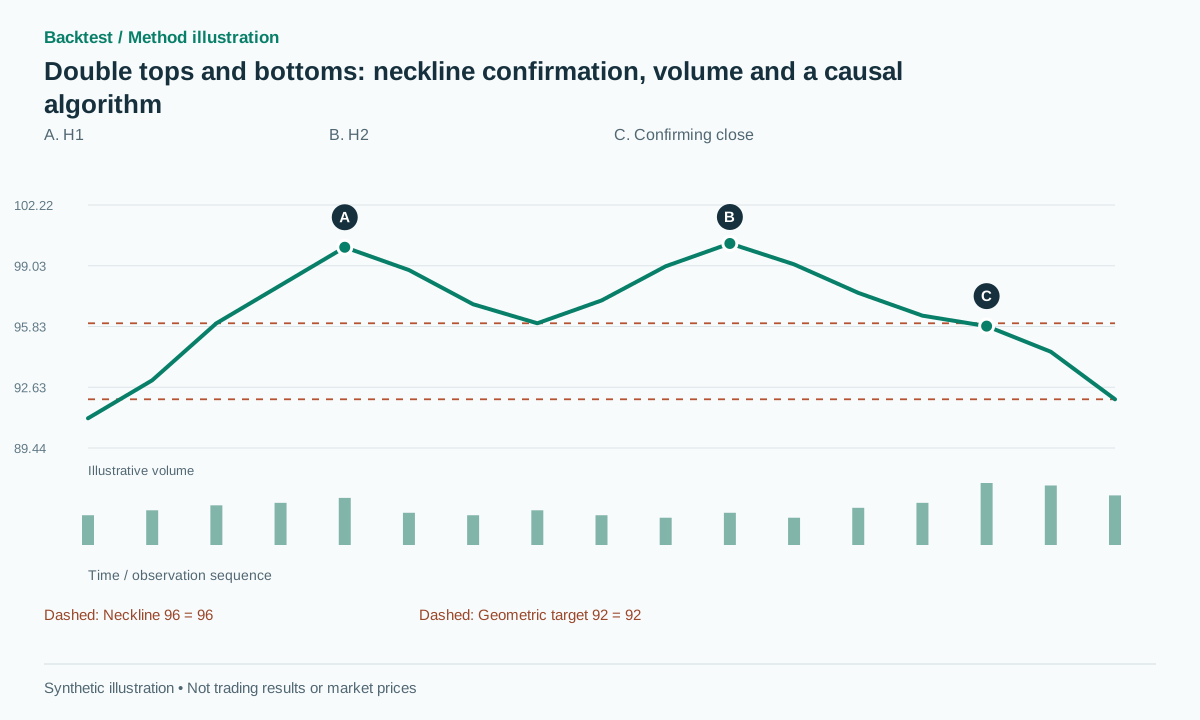 Open full-size illustration
Practical workflow
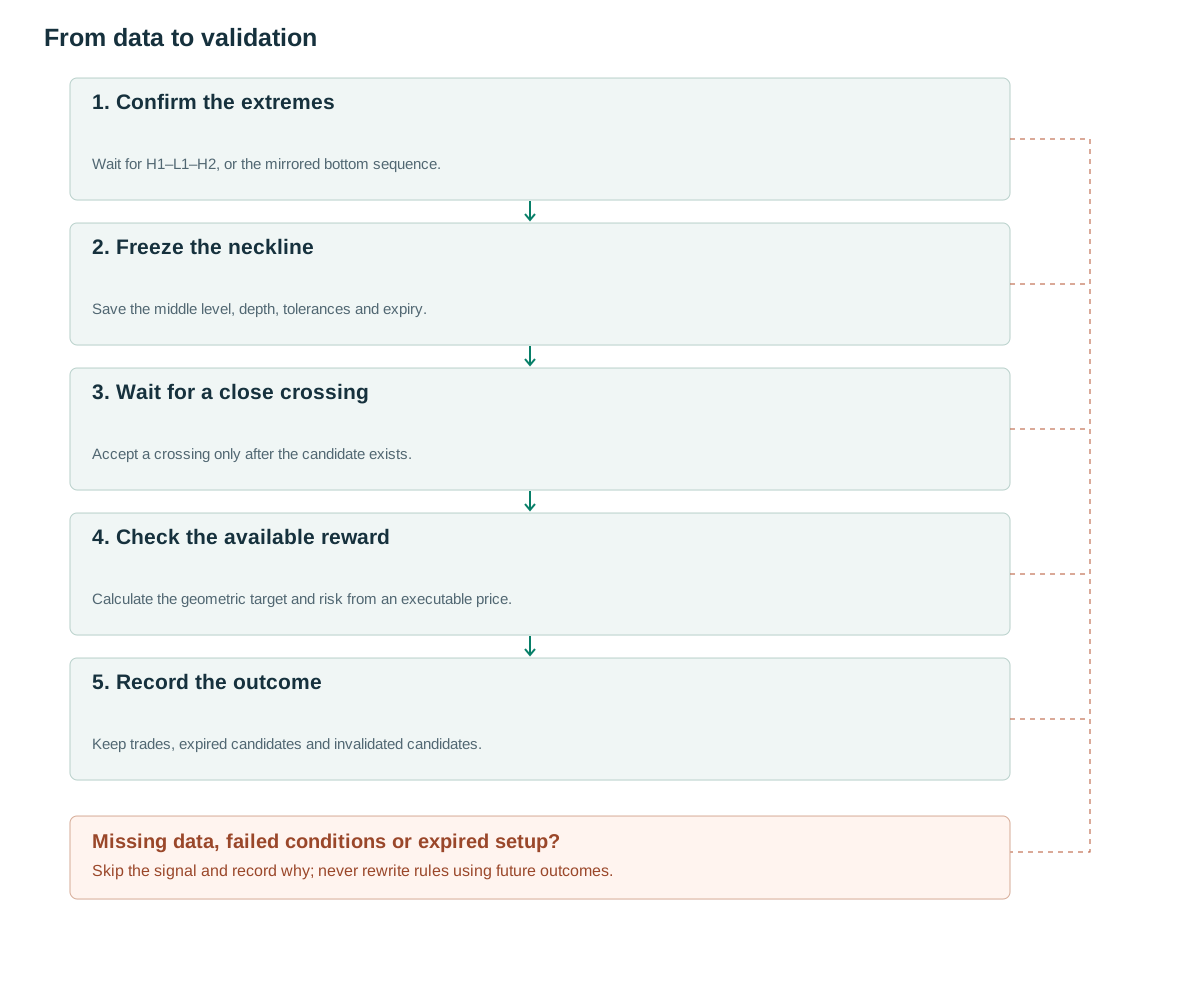
- Confirm the extremesWait for H1–L1–H2, or the mirrored bottom sequence.
- Freeze the necklineSave the middle level, depth, tolerances and expiry.
- Wait for a close crossingAccept a crossing only after the candidate exists.
- Check the available rewardCalculate the geometric target and risk from an executable price.
- Record the outcomeKeep trades, expired candidates and invalidated candidates.
What the structure tells us
A double top contains two similar highs separated by a low; a double bottom reverses those relationships. The intervening extreme defines the neckline. Breaking that neckline completes the chart structure described by IG. [1] The source provides a pattern definition, not evidence that every implementation or volume threshold will be profitable.
A useful working interpretation is that price attempts to continue and then fails. However, two touches do not identify who is distributing or accumulating inventory. Before the neckline breaks, the same outline can remain a pause within the existing trend. A detector should therefore publish three distinct outcomes: candidate created, confirmation observed, and candidate invalidated or expired. Keeping those outcomes separate prevents an untraded observation from being recorded as either a winning or losing trade.
Rules using information already available
All thresholds in this implementation are research proposals. Use pivots requiring three bars on the left and three on the right. Publish a pivot only after the third right-hand bar closes: pivots have a confirmation delay. [2] When the second top becomes available, freeze A = ATR(14), epsilon = max(2 ticks, 0.15A), and breakout buffer b = max(2 ticks, 0.10A).
For the chronological sequence H1, L1, H2, define depth D = min(H1,H2) − L1. Require D ≥ 1.5A and |H2−H1| ≤ max(2epsilon, 0.1D). The two highs must be at least seven bars apart. An uptrend before H1 can be defined as two already-confirmed higher-high/higher-low pairs. Select that context rule before evaluating results; do not infer the earlier trend from what happens after the pattern.
Set the neckline N=L1. Only consider the first qualifying close below N−b after H2 has been confirmed and the candidate has been created. If price crossed the neckline during the pivot-confirmation delay, this version misses that crossing. It must not move a signal backward in time. Expire the candidate after half the pattern duration, rounded upward, with a minimum of five bars.
Store both the extreme timestamp and its confirmation timestamp. For example, an H2 occurring at bar 45 becomes available after bar 48 when the right window is three bars. A candidate created at the close of 48 may begin looking for a crossing at bar 49. This separation also makes it possible to test that appending new bars never changes an already-published signal.
on_close(t):
  update_confirmed_pivots(left=3, right=3)
  if new_H2 and valid(H1,L1,H2): freeze(candidate, A, N, D, expiry)
  if candidate and t > candidate.created:
    if High[t] > max(H1,H2)+epsilon: cancel
    elif t > expiry: expire
    elif Close[t-1] >= N-b and Close[t] < N-b: emit SHORT
# For double bottoms, reverse comparisons and use L1-H1-L2 with LONG.
Giving volume a specific job
Test volume in separate layers: no volume filter, lower volume around the second high, and higher volume at the neckline break. For daily data, one proposed measure is RVOL = V[t]/median(V[t−20:t−1]). A threshold of 1.5 is an experimental setting, not a universal rule. Compare equal-length windows around the highs; otherwise a longer first upswing may appear more active simply because it contains more bars.
Reduced activity on the second attempt is consistent with one possible failure-to-continue hypothesis, but elevated activity can also accompany absorption. A single volume column does not establish that buyers have become weak. For intraday data, use comparable time slots across previous sessions. Record missing or abnormal zero volume as unavailable rather than treating it as exceptionally strong evidence of a dry-up.
Numerical examples and failure cases
Synthetic example: H1=100, L1=96, H2=100.2, A=1 and tick size=0.01. Then D=4, epsilon=0.15 and b=0.10. The 0.2 difference between highs is within the 0.4 tolerance. A close at 95.85 confirms the break. If a short can actually be entered at 95.75, the structural stop is 100.35 and the projected target N−D is 92. The potential reward is 3.75 against risk of 4.60: only 0.82R before costs. The pattern is valid, but it fails a proposed minimum of 1.5R.
Failure example: after the same initial structure, price closes at 96.05 and then rises to 100.6. No close below 95.90 occurred, so the candidate was invalidated without a trade. In a different path, a short already entered at 95.75 can rebound into its stop. That trade remains a loss even if a later chart makes the breakout look obviously false. Pattern validity, trigger validity and trade outcome are different labels.
Entry, invalidation and exits
The baseline enters at the next executable event after the confirming close. Place the stop above the higher peak plus epsilon, and freeze the target at N−D. A stop above H2 alone is a separate strategy with a different risk distribution. For double bottoms, put the stop below the lower trough and project the target to N+D.
Before submitting an order, use an available executable quote to calculate risk per unit and position size under a fixed risk budget. A gap observed after an order has already filled cannot retrospectively cancel that trade. If both stop and target fall inside one later OHLC bar, use finer data or a preregistered conservative ordering convention.
A useful execution test inserts a gap between confirmation and the next tradable quote. The detector should still retain the same signal timestamp and structural levels, while the execution layer changes the fill, position size or pre-submission rejection reason. This distinguishes a failure to trade economically from a failure to recognize the pattern. Include spread, commissions and slippage in the final reward-to-risk calculation.
Testing incremental value
A useful control is a break of the most recent low after an uptrend, without requiring two similar highs. Compare net expectancy, drawdown, opportunity count and the number of candidates rejected for poor reward-to-risk. Do not evaluate only whether price initially moved in the predicted direction. Use chronological development and test samples, with tolerances fixed before the final test. [3] provides research context rather than validation of this configuration.
Save every candidate when it is created, including those that expire. Collecting only completed patterns systematically removes failures before confirmation. Merge overlapping candidates around the same price region into one event, or apply a stated one-position-per-region policy. Separate reversal attempts from continuation failures when reporting results.
Implementation checks should include unequal highs just inside and outside tolerance, a neckline touch without a qualifying close, an early crossing during the pivot delay, expiration immediately before a crossing, and a bar that breaches structural invalidation as well as the neckline. The pseudocode gives invalidation priority for that final case. A different ordering is possible, but must be a named version rather than a choice made after seeing the outcome.
Common pitfalls
Entering at the second extreme
That is an anticipatory strategy with different timing from neckline confirmation; report it separately.
Redrawing highs to rescue a candidate
Freeze anchors. If updates are allowed, create a new candidate version with its own timestamp.
Attractive target, excessive risk
Pattern height does not guarantee enough remaining reward to cover the stop distance and execution costs.
Checklist before using this method
Check each item after verifying it on your data. Progress is saved in this browser; it does not certify a profitable strategy.
Frequently asked questions
Must the two highs have exactly the same price?
No. A tolerance based on ATR and tick size avoids dependence on nominal price. Test nearby tolerances rather than choosing one that fits a few attractive examples.
Is a neckline retest compulsory?
No. A retest entry is a separate variant that needs a waiting period, reaction trigger and rule for missed trades. Do not assume every breakout returns to the neckline.
Research sources
Each source supports the definition or evidence described beside it. The pseudocode, synthetic examples and proposed parameters require separate validation.
- IG: How to trade double tops and double bottomsIG. Pattern geometry and confirmation terminology; the relevant public section was read. Checked: .
- TradingView: RepaintingTradingView. Pivot confirmation delay and repainting. Checked: .
- Lo, Mamaysky, Wang: Foundations of Technical AnalysisNBER / Columbia University. Background on systematic pattern research; this configuration is not tested by the paper. Checked: .
Related methods
Risk note
This content supports education and research design, not financial advice. Backtest is historical simulation, does not guarantee future performance and does not place real trades. Methods in this library are not automatically features available in the app. See methodology and learning center.
Validate rules before risking real capital
Check app support, data and individual simulated trades; advanced detectors may require a separate implementation.
Download Backtest on the App Store