Article contents
Evidence and scope
The cited material supports terminology and research context. The numerical thresholds, state machine, execution policy and synthetic examples below are proposed by this research project. No new backtest has been run, and the references do not establish profitability for this configuration.
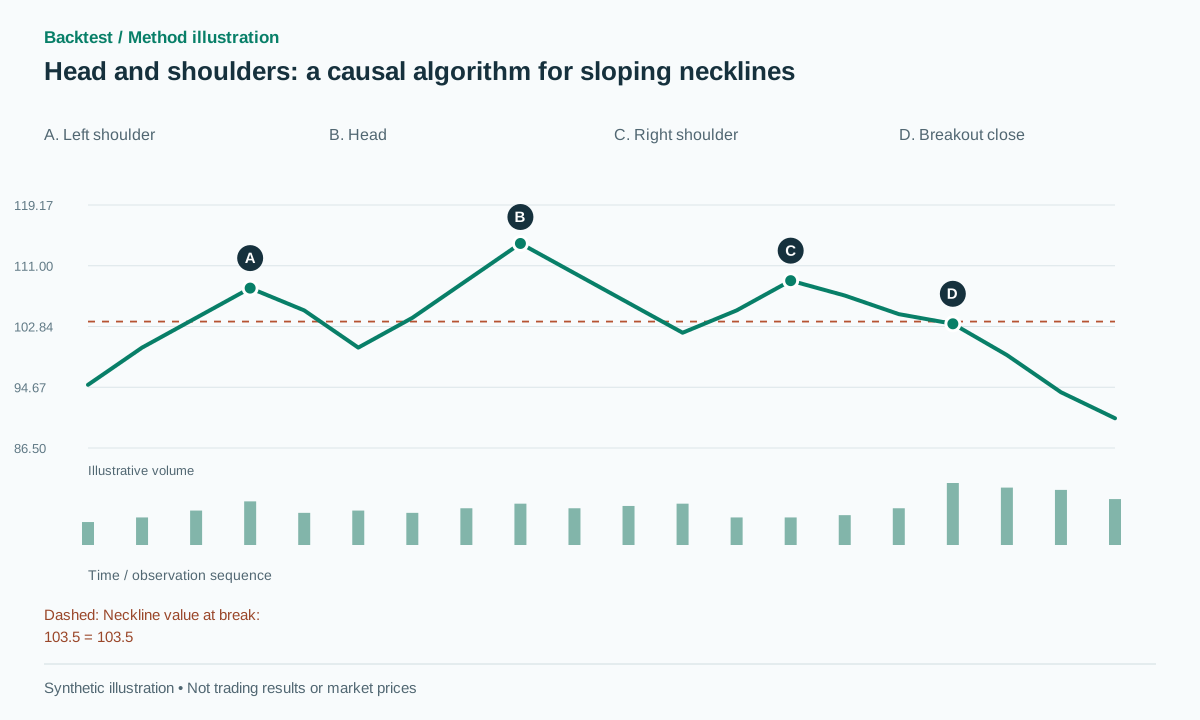 Open full-size illustration
Practical workflow
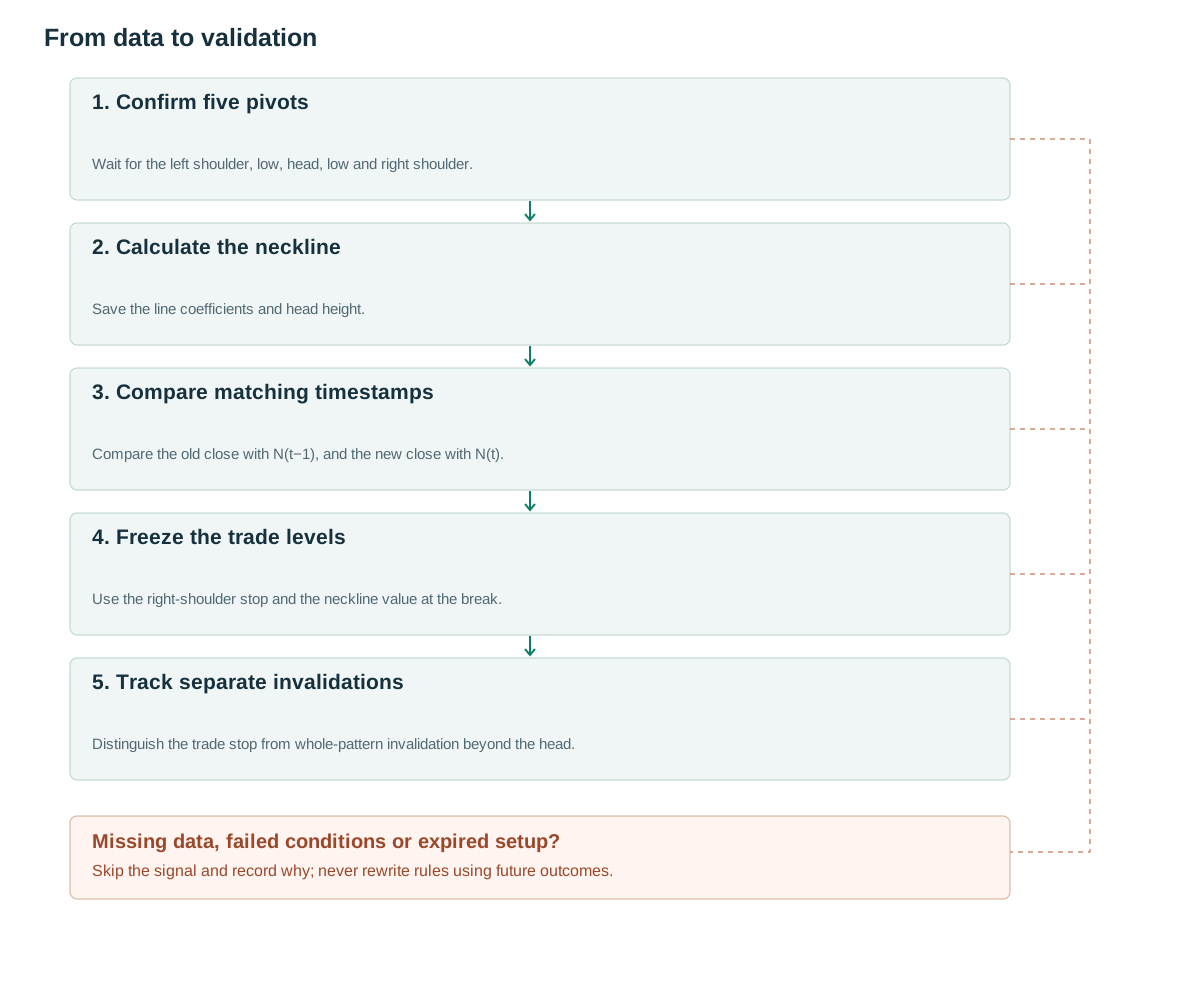
- Confirm five pivotsWait for the left shoulder, low, head, low and right shoulder.
- Calculate the necklineSave the line coefficients and head height.
- Compare matching timestampsCompare the old close with N(t−1), and the new close with N(t).
- Freeze the trade levelsUse the right-shoulder stop and the neckline value at the break.
- Track separate invalidationsDistinguish the trade stop from whole-pattern invalidation beyond the head.
What the structure tells us
The usual structure consists of a left shoulder, a higher head, a right shoulder and a neckline through the two intervening lows. A neckline break completes the pattern. The inverse version uses three lows, with the middle low deepest. [1] This describes an outline and its confirmation event rather than an assured reversal.
The research hypothesis is that price stops extending its prior extreme and then breaks the opposing structure. The right shoulder need not equal the left shoulder exactly. However, if every height difference and time imbalance is accepted, nearly any zigzag can receive the label. Explicit tolerances make it possible to reject unsuitable candidates and measure how often the proposed structure occurs.
Separate the pattern detector from the trade manager. A candidate can satisfy the geometry but never cross its neckline. A confirmed break can offer poor reward-to-risk at the available fill. A valid trade can still lose. These distinctions make the research dataset more useful than a collection of charts selected because their eventual direction looks convincing.
Rules using information already available
The following implementation settings are research proposals. Use a chronological sequence of confirmed pivots H1,L1,H2,L2,H3, with three left-hand and three right-hand bars. Define N(t)=L1+(L2−L1)(t−tL1)/(tL2−tL1). Freeze A=ATR(14) when H3 becomes available, epsilon=max(2 ticks,0.15A) and breakout buffer b=max(2 ticks,0.10A). The head height is D=H2−N(tH2), and must be at least 1.5A.
Require the head to exceed the higher shoulder by at least 0.5A. The shoulders may differ by no more than max(2epsilon,0.2D). Each shoulder must stand at least epsilon above the neckline evaluated at that shoulder’s own timestamp. Require the left-shoulder-to-head duration divided by the head-to-right-shoulder duration to fall between one third and three.
Limit the absolute change in neckline value from the left shoulder to the right shoulder to 0.5D. Freeze the line coefficients at candidate creation. The downward crossing test is C[t−1]≥N(t−1)−b and C[t]<N(t)−b. Comparing the previous close with the current line value is incorrect when the line slopes.
Do not backdate signals into the three bars spent confirming the right shoulder. Pivots become available with a delay. [2] Expire the candidate after half the pattern duration, rounded upward, with a minimum of five bars. The inverse pattern reverses the extreme types and inequalities, while preserving the confirmation delay and timestamp logic.
on confirmed right_shoulder:
  compute fixed neckline coefficients m,q; N(t)=m*t+q
  if geometry_valid: create candidate(time=now, height=D)
for later bar t:
  if High[t] > H2+epsilon: cancel
  elif t > created+max(5,ceil(pattern_duration/2)): expire
  elif C[t-1] >= N(t-1)-b and C[t] < N(t)-b:
    signal SHORT; target=N(t)-D; stop=H3+epsilon
# Inverse pattern: reverse extreme types, inequalities and trade direction.
Giving volume a specific job
Volume can be measured at the neckline break or compared around the head and right shoulder. Treat each choice as a separate feature. For example, define breakout RVOL as breakout volume divided by the median volume of the preceding 20 bars, then test RVOL of at least 1.5. Save the candidates that fail the filter so that the effect of excluding them can be evaluated.
Lower right-shoulder volume is a hypothesis about the activity accompanying the final attempt, not proof that institutional sellers are in control. Use equal-length windows or per-bar averages around the selected regions. Otherwise, a shorter shoulder can appear weaker solely because fewer bars were counted.
For daily equities, flag earnings sessions, splits and very low liquidity. On intraday charts, normalize activity against the same time slots of previous sessions. A gap through the neckline requires a separate fill calculation: elevated volume does not restore a hypothetical entry at the line after the first executable price has already moved well beyond it.
Numerical examples and failure cases
Synthetic example: the five pivots have time/price coordinates (10,108),(20,100),(30,114),(40,102),(50,109). Therefore N(t)=98+0.1t and D=13. At t=55 the neckline is 103.5. With A=2, tick size=0.01, b=0.2 and epsilon=0.3, a close at 103.2 confirms the break if the preceding close was at least N(54)−0.2=103.2. A feasible short at 103.1 has a right-shoulder stop at 109.3 and target at 90.5. Risk is 6.2 and projected reward is 12.6, or about 2.03R before costs.
Failure example: with the same geometry, a close at 103.4 on bar 55 has not broken the required threshold. Alternatively, an already-entered short can rebound to 109.4 and hit its protective stop. The fact that the head at 114 remains intact does not rescue that trade. Structural invalidation beyond the head and a trade stop beyond the right shoulder serve different purposes.
The numerical example also tests the slope filter. The neckline moves from 99 at the left shoulder to 103 at the right shoulder, a change of 4, below 0.5D=6.5. Shoulder heights differ by 1, below the 2.6 tolerance. These checks establish that the proposed detector would accept the geometry; they are not evidence about the probability of reaching 90.5.
Entry, invalidation and exits
The baseline submits an order after the confirming close, places the stop outside the right shoulder and projects the head height from the neckline value at the break. Freeze that target. It must not drift with the neckline on later bars. If the available entry has moved far from the line, calculate reward-to-risk using the executable quote before submitting a new order.
A more distant stop above the head is a different strategy and usually reduces geometric reward-to-risk. Waiting for a neckline retest is another variant that needs its own expiry and reaction trigger. Do not mix the best entry and stop from these alternatives for each individual chart after observing the outcome.
For an inverse pattern, the direction changes from short to long, but gap risk remains. Check position size, liquidity, spread and total portfolio exposure. If a resting protective stop is crossed by a gap, use a feasible fill rather than assuming the intended stop price caps the loss. If a single bar could touch both stop and target, use finer data or a declared conservative ordering policy.
Testing incremental value
Compare the pattern with a break of the latest low under the same prior-trend filter. This tests whether the shoulder-head-shoulder shape adds information beyond a generic momentum reversal. Report results by neckline slope, shoulder imbalance and formation duration, using groups chosen before inspecting the final test set.
Keep extreme timestamps, confirmation timestamps, signal times and order times as separate fields. Apply chronological out-of-sample testing, commissions, spread and slippage. The research paper [3] does not establish profitability for this detector or its target. Small subgroups need wider uncertainty intervals rather than a precise-looking win rate.
Unit-level checks should cover a flat neckline, positive and negative slopes, a right shoulder that is below the line at its own timestamp, and a crossing that occurs before shoulder confirmation. An especially useful test holds all prices fixed while changing only the line slope: comparing both closes with N(t) should disagree with the correct N(t−1)/N(t) calculation in some cases. A replay test should also confirm that adding future bars cannot revise an earlier accepted or rejected signal.
Common pitfalls
Moving the neckline using future pivots
Do not reconnect later lows after a signal to make the break look cleaner.
Trading before the right shoulder exists
Selling a rally can be a separate strategy, but it is not a completed confirmed-pivot pattern.
Requiring perfect visual symmetry
Exact equality excludes many structures; unlimited tolerance makes the label meaningless. Test a small declared range of tolerances.
Checklist before using this method
Check each item after verifying it on your data. Progress is saved in this browser; it does not certify a profitable strategy.
Frequently asked questions
Must the neckline be horizontal?
No. A sloping line requires a time-based formula and a slope limit that prevents severely distorted structures from being accepted.
Does a target equal to head height have to be reached?
No. It is a geometric projection. Compare it with a fixed-R target and a trailing exit on the same entries, using out-of-sample data.
Research sources
Each source supports the definition or evidence described beside it. The pseudocode, synthetic examples and proposed parameters require separate validation.
- IG Academy: Basic chart patterns part oneIG. Basic geometry and confirmation terminology; the relevant public section was read. Checked: .
- TradingView: RepaintingTradingView. Pivot confirmation delay and repainting. Checked: .
- Lo, Mamaysky, Wang: Foundations of Technical AnalysisNBER / Columbia University. Background on systematic pattern research; this configuration is not tested by the paper. Checked: .
Related methods
Risk note
This content supports education and research design, not financial advice. Backtest is historical simulation, does not guarantee future performance and does not place real trades. Methods in this library are not automatically features available in the app. See methodology and learning center.
Validate rules before risking real capital
Check app support, data and individual simulated trades; advanced detectors may require a separate implementation.
Download Backtest on the App Store