Article contents
Evidence and scope
The cited material supports terminology and research context. The numerical thresholds, state machine, execution policy and synthetic examples below are proposed by this research project. No new backtest has been run, and the references do not establish profitability for this configuration.
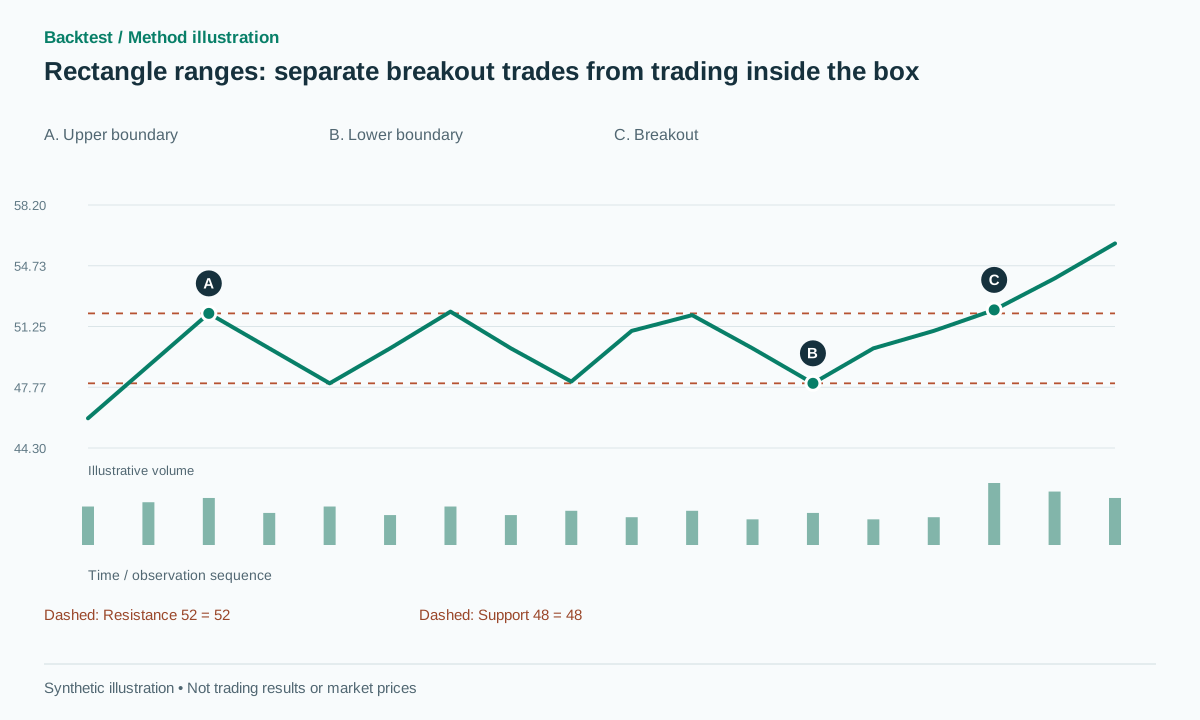 Open full-size illustration
Practical workflow
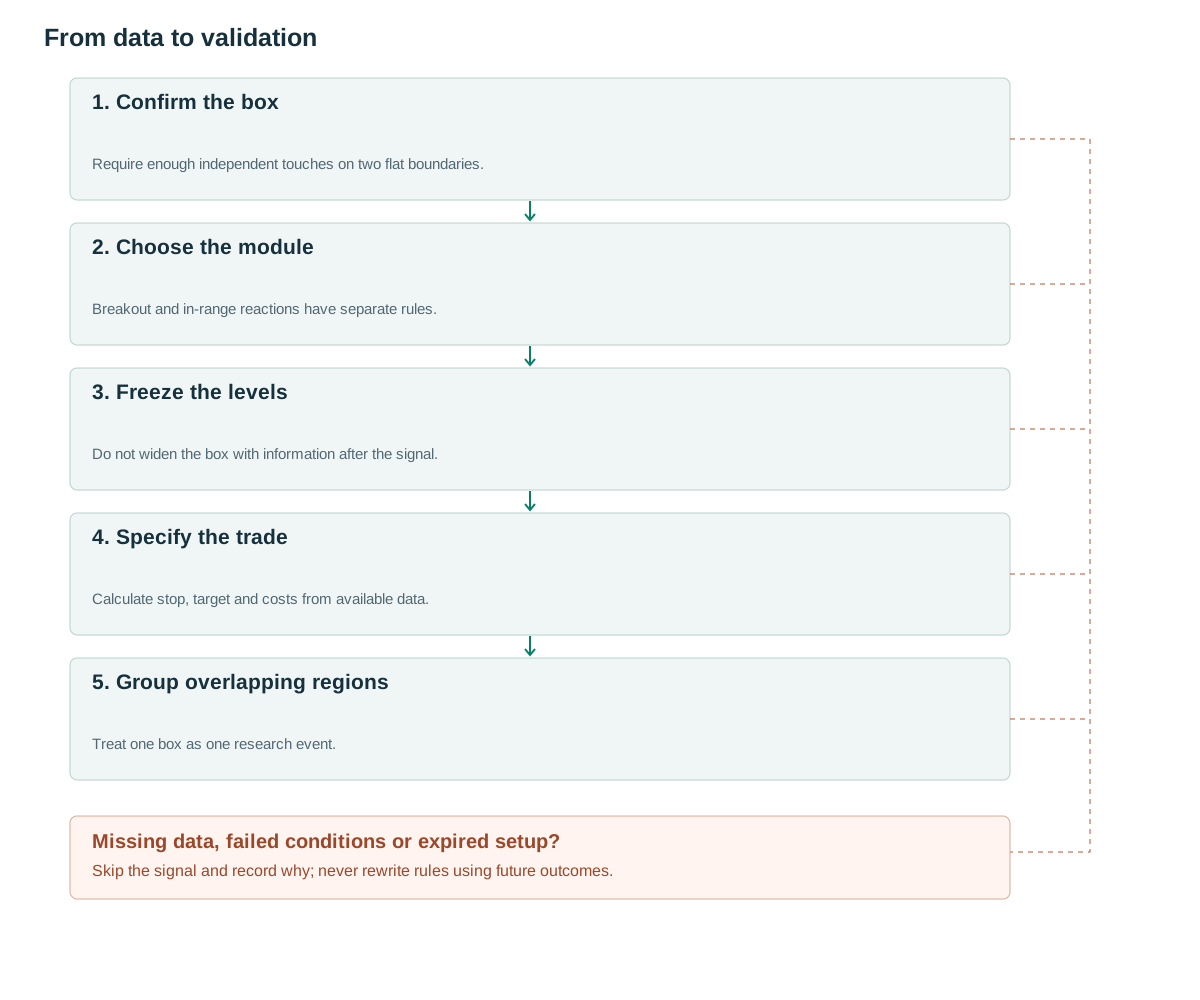
- Confirm the boxRequire enough independent touches on two flat boundaries.
- Choose the moduleBreakout and in-range reactions have separate rules.
- Freeze the levelsDo not widen the box with information after the signal.
- Specify the tradeCalculate stop, target and costs from available data.
- Group overlapping regionsTreat one box as one research event.
What the structure tells us
A rectangle has two approximately horizontal boundaries; IG presents it among continuation patterns. [1] A geometry-only detector should establish that price is ranging, while a continuation label additionally depends on the prior trend and eventual exit direction.
At a boundary, price may reject the level or begin a breakout. A system that buys support and simultaneously prepares to sell its failure needs an explicit state policy. Separating those modules makes it possible to determine where any returns originate rather than allowing the preferred explanation to change after each trade.
The box is an observed region, not a promise that support or resistance will hold. Its usefulness lies in creating levels that can be frozen before an event. An honest dataset retains both reactions that succeed inside the range and the transitions that end it.
Rules using information already available
Proposed settings: use pivots confirmed with three bars on each side in a 20–100-bar window. Require at least three independent touches on each side, with same-side touches at least seven bars apart. Let U be the median of the selected pivot highs, B the median of pivot lows and D=U−B. Require D≥1.5A, where A=ATR(14) when the final required touch becomes confirmed.
Fit lines through the touches only to measure their slopes. Require |slope×T/D|≤0.25 on both sides. Each anchor must be within epsilon=max(2 ticks,0.15A) of its boundary, or within a preselected depth-based tolerance such as 0.1D. Those are alternative tolerance versions, not interchangeable choices for individual charts. Require at least 90% of closes to lie within [B−epsilon,U+epsilon].
Freeze U and B when the candidate is created. Expire it after another T bars or consume it on the first accepted boundary break. Do not widen the box using the breakout bar to conceal a failed range. Pivots are available only after confirmation. [2] A line drawn backward for illustration must still carry a separate activation timestamp.
Touch clustering matters. Several neighboring highs near resistance do not constitute three independent attempts if price never makes a meaningful intervening excursion. The pivot sequence and minimum spacing provide a reproducible starting definition. A different clustering rule is valid research, but changes the detector and must be versioned.
on complete confirmed box:
  freeze U,B,D,A,expiry=created+T; state=RANGE
for later closed bar t:
  if t>expiry: state=EXPIRED
  elif state==RANGE and C[t-1]<=U+b and C[t]>U+b:
    emit LONG_BREAKOUT; state=CONSUMED
  elif state==RANGE and C[t-1]>=B-b and C[t]<B-b:
    emit SHORT_BREAKOUT; state=CONSUMED
# b=max(2 ticks,0.10A). Range-bounce is a separate module, disabled by default.
Giving volume a specific job
For breakout trades, test RVOL≥1.5 relative to the preceding 20-bar median. For trades inside the range, the question is different: how much activity accompanied the boundary test, and how far did price actually travel? Heavy activity without much displacement does not by itself prove absorption, but the combination can be stored as a measurable feature.
Compare the volume-filtered breakout with the same breakout rule without volume. Flag boxes whose quiet activity reflects poor liquidity: a visually tidy range can still be expensive to trade. Volume is not a substitute for bid–ask information when the question is execution cost.
For a bounce module, define its volume measurement before looking at outcomes. Comparing the average activity of equal-length approach windows is different from selecting one unusually quiet rejection bar. Keep the continuous values so that the contribution of the chosen filter can be separated from the price reaction itself.
Numerical examples and failure cases
Synthetic example: U=52, B=48, A=1, b=0.1 and epsilon=0.15. Once the box is confirmed, a close at 52.2 crosses the upper threshold. A feasible long at 52.25, a stop beyond the final opposite pivot at 50.85 and a projected target U+D=56 imply risk of 1.4 and reward of 3.75, approximately 2.68R before costs. If protection instead sits beyond the whole box at 47.85, reward-to-risk falls to about 0.85R. These stop policies cannot be pooled as though they were identical.
Failure example: a close at 52.05 remains inside the breakout buffer and produces no signal. A long already filled at 52.25 that returns into the box and reaches 50.85 is a stopped trade. In the separate bounce module, a long near 48.2 followed by a close at 47.8 violates the in-range thesis; it cannot silently become a long-term holding.
A useful accounting distinction is that a return inside the box need not hit the structural stop. If an early-exit rule closes on that return, its result will differ from a strategy that waits for the stop. Store which exit fired and its timestamp instead of labeling both outcomes generically as a failed breakout.
Entry, invalidation and exits
The breakout baseline uses the final confirmed opposite pivot for protection. If that point is too distant, reduce size or reject the trade under a reward-to-risk rule before submitting the order. Freeze the target from the original box height. Exiting early when a close returns inside the box is an alternative that may reduce holding time but may also create additional whipsaws.
The range-bounce module instead requires contact with a boundary followed by a close back inside, a stop outside that boundary and a target at the midpoint or opposite side. Do not move the target by raising U after entry. If both modules operate, impose a shared risk limit and a priority rule established before results are observed.
One practical policy is to stop opening bounce trades after the first confirmed breakout, while allowing the existing position to follow its original exit rules. Another policy closes or reverses immediately. Either can be tested, but the transition must use information known then and feasible order prices. A later profitable break cannot justify retroactively choosing the better transition policy.
Testing incremental value
Use a Donchian-style rolling-window breakout of the same length as a control, without requiring repeated touches. This tests whether repeated validation of a region adds information sufficient to compensate for later recognition. For the bounce module, evaluate gains inside ranges together with losses when new trends begin.
Report the number of boxes, time in existence, first-break direction, filled trades, net expectancy and drawdown. Merge nearly identical boxes so that one price region does not create many pseudo-independent observations. The proposed configuration has not received a new backtest; [3] supplies methodological context only.
Recognition tests should include three genuine touches on each side, a cluster of adjacent highs that counts only once, a box with too many closes outside its boundaries and one with an isolated bad-data wick. Execution tests should cover a gap beyond resistance, a same-bar stop/target ambiguity and two modules attempting opposite positions at once. The resulting behavior must match the declared portfolio policy.
Common pitfalls
Assuming every sideways region is a good box
Large wick violations and wide spreads can make protection unstable.
Buying and selling the same boundary without a policy
Conflicting modules need portfolio rules rather than a resolution chosen from future outcomes.
Counting neighboring touches repeatedly
A cluster around one extreme is one test unless price makes a distinct intervening excursion.
Checklist before using this method
Check each item after verifying it on your data. Progress is saved in this browser; it does not certify a profitable strategy.
Frequently asked questions
Must a rectangle follow a trend?
Not for geometric recognition. A continuation study should add a separate prior-trend filter and compare it with the unfiltered group.
Should the stop sit outside the box or near the final pivot?
Both can be researched. The closer stop improves geometric reward-to-risk but may increase early stop-outs; report the variants independently.
Research sources
Each source supports the definition or evidence described beside it. The pseudocode, synthetic examples and proposed parameters require separate validation.
- IG Academy: Basic chart patterns part twoIG. Rectangle geometry and continuation terminology; the relevant public section was read. Checked: .
- TradingView: RepaintingTradingView. Pivot confirmation delay and repainting. Checked: .
- Lo, Mamaysky, Wang: Foundations of Technical AnalysisNBER / Columbia University. Background on systematic pattern research; this configuration is not tested by the paper. Checked: .
Related methods
Risk note
This content supports education and research design, not financial advice. Backtest is historical simulation, does not guarantee future performance and does not place real trades. Methods in this library are not automatically features available in the app. See methodology and learning center.
Validate rules before risking real capital
Check app support, data and individual simulated trades; advanced detectors may require a separate implementation.
Download Backtest on the App Store