Article contents
Evidence and scope
The cited material supports terminology and research context. The numerical thresholds, state machine, execution policy and synthetic examples below are proposed by this research project. No new backtest has been run, and the references do not establish profitability for this configuration.
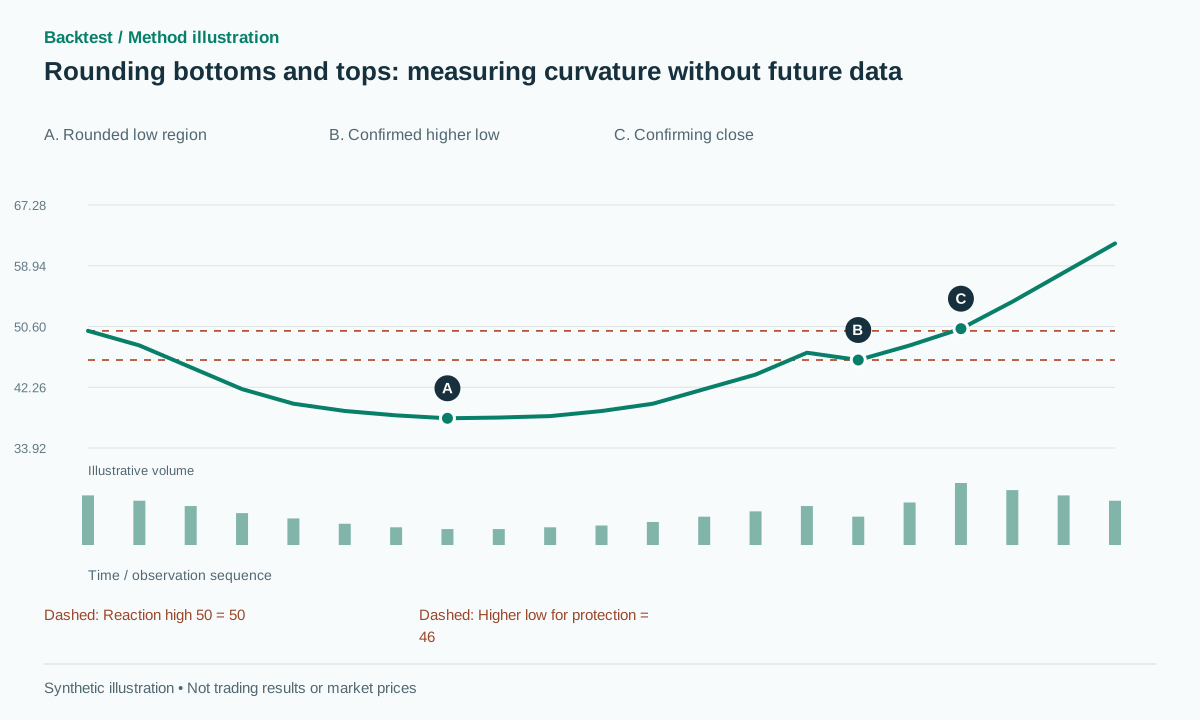 Open full-size illustration
Practical workflow
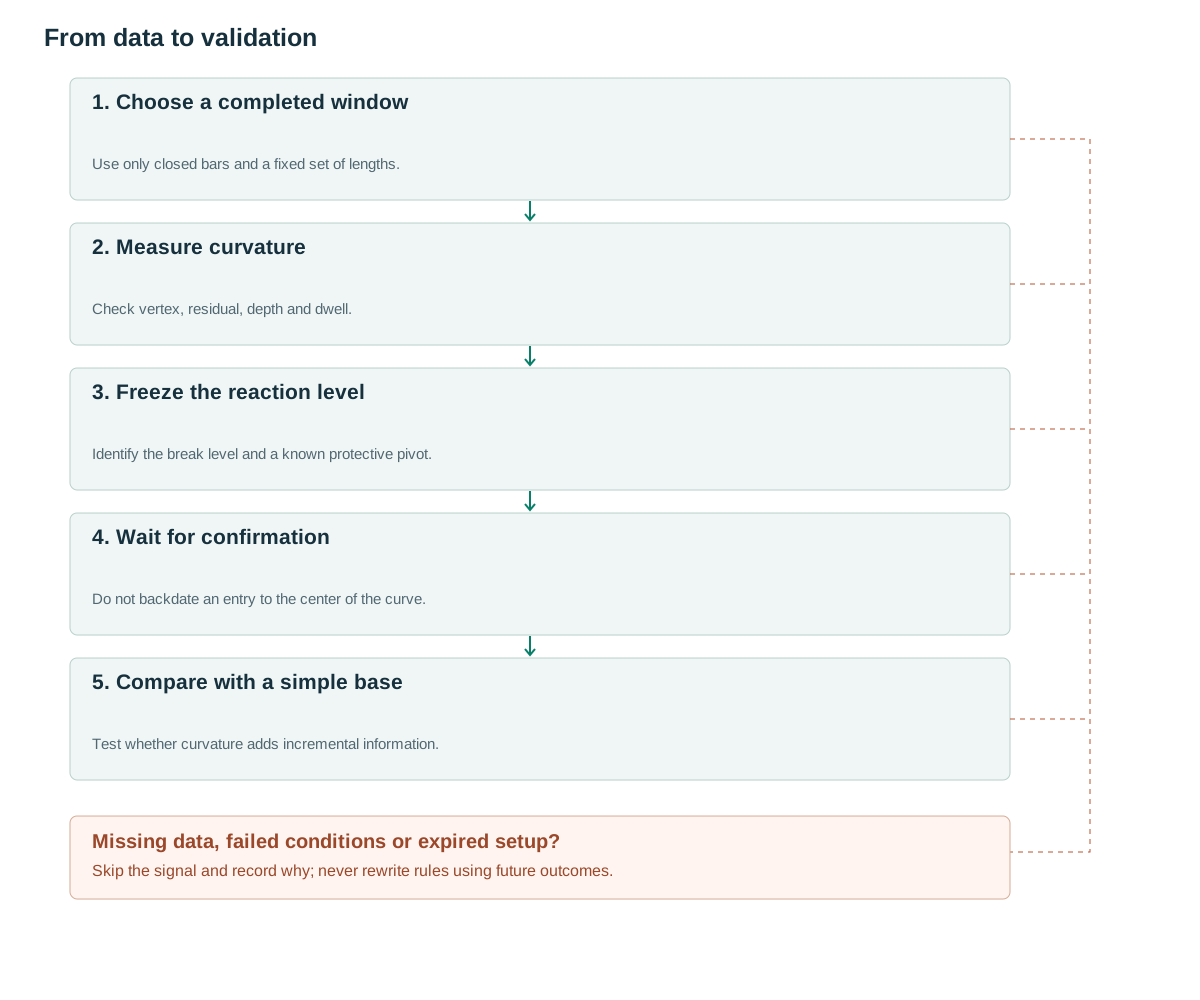
- Choose a completed windowUse only closed bars and a fixed set of lengths.
- Measure curvatureCheck vertex, residual, depth and dwell.
- Freeze the reaction levelIdentify the break level and a known protective pivot.
- Wait for confirmationDo not backdate an entry to the center of the curve.
- Compare with a simple baseTest whether curvature adds incremental information.
What the structure tells us
ChartSchool describes a rounding bottom as a longer reversal structure containing decline, a low region and recovery, with a break above a reaction high providing confirmation. [1] A weekly-chart description should not be transferred to a few minutes by assuming the same economic behavior.
Heavy smoothing can manufacture a visually pleasing curve. Preserve the raw series to distinguish a broad base from a rapid V reversal. A rounding top is the opposite geometric hypothesis; the source’s bottom discussion does not automatically establish equivalent evidence for tops.
The detector should answer two questions separately: has enough of a curved structure become observable, and has price crossed a predefined level that permits a trade? At the lowest point, the recovery side is still unknown. Calling that point a completed rounding bottom would use information from the future.
Rules using information already available
Proposed settings: evaluate completed windows of 30–150 bars using a fixed set of lengths chosen before testing. Take median closes in blocks of three to five bars, normalize time u to [0,1], and fit y=au²+bu+c. A bottom requires a>0 with the vertex between 25% and 75% of the window. A top requires a<0 with its maximum in the same central interval.
For a bottom, R is a confirmed reaction high near the start of the base, L is the lowest observed low, and D=R−L≥1.5A, with A=ATR(14) at candidate creation. Require root-mean-square residual≤0.2D and at least 15% of bars below L+0.25D. A three-segment model with negative, near-zero and positive slopes is another possible detector, not an interchangeable fit selected afterward.
Once sufficient data exist, freeze R,D and wait for a later close crossing R+b, where b=max(2 ticks,0.1A). Do not claim detection at the lowest bar because the right side was not yet available. Reaction-high and stop pivots use three-bar left/right confirmation. [2]
Deduplicate overlapping eligible windows. One proposed policy retains the earliest qualifying candidate for a region; another selects a fixed window length. Either policy needs to be specified before examining the resulting trades. Selecting the most attractive curve after its outcome is known defeats the purpose of quantitative recognition.
on each eligible closed window:
  fit quadratic on past block medians
  if shape,depth,dwell valid and no duplicate region:
    freeze R,D,A,created,expiry=created+ceil(window/2)
for later bar t:
  if Low[t]<L-epsilon or t>expiry: cancel
  elif C[t-1]<=R+b and C[t]>R+b:
    signal LONG; stop=last_confirmed_higher_low-epsilon
    target=R+D
# epsilon=max(2 ticks,0.15A). If no suitable higher low exists, skip;
# a stop beneath the whole base is a separate version.
Giving volume a specific job
Volume can be measured across three portions of the base to test whether activity declines near the middle and recovers on the right. The source discusses a U-shaped volume profile, but treat that description as a quantitative hypothesis. [1] Compare median per-bar activity rather than totals when portions have different durations.
Breakout RVOL is separate from the volume shape of the entire base. Compare no volume filter, breakout activity alone, and both the base profile and breakout activity. A single event can dominate weekly volume. A decision made after the weekly close can use the completed weekly volume once received, but that information must not be backdated into an earlier daily decision made before it was available.
Keep smoothing of price separate from smoothing of volume. Applying the same heavy smoothing to both can make them look aligned even when individual event timing differs. Store the original volume features so that later analysis can identify whether a filter is reacting to a persistent pattern or one exceptional session.
Numerical examples and failure cases
Synthetic example: R=50, L=38, A=2 and D=12. In an 80-bar window, 18 bars lie below 41, giving dwell of 22.5%. The fitted vertex is at u=0.48 and residual RMS=1.5, below 2.4. The final confirmed higher low is 46. A close at 50.3 lies above R by more than the buffer b=0.2; a feasible entry at 50.4, stop at 45.7 and target at 62 imply risk of 4.7 and reward of 11.6, about 2.47R before costs.
Recognition failure: a fall from 50 to 38 and immediate recovery to 50 in eight bars fails the duration and dwell conditions. Trade failure: a complete qualifying pattern enters and later reaches 45.7. The loss remains valid even though the larger low at 38 has not been broken. A nearby trade stop and invalidation of the whole base are different concepts.
For a successful synthetic path, price reaches 62 before the protective stop. The curved fit does not predict that endpoint; the projection is an independent exit hypothesis. If the implementation switches to a trailing exit, record that as another experiment rather than crediting the original fixed-target strategy with whichever outcome is better.
Entry, invalidation and exits
The baseline waits for a break of the reaction high and uses the nearest confirmed higher low for protection. If no suitable higher low is available, skip the trade. Do not treat a low observed for only one bar as a confirmed swing. A stop outside L is simpler to specify but often produces much lower reward-to-risk, so report it separately.
R+D is a proposed height projection rather than an inevitable destination of the curve. A pivot trail can investigate longer trends, but its update rule must be fixed before viewing the rally. The rounding-top version reverses trigger and protection, with separate checks for short availability and financing costs.
Use an executable quote after confirmation and retain gap slippage. A wide rounded base can place the structural stop far from entry; fixed monetary risk then implies fewer units. Holding size constant across shallow and deep bases changes the portfolio’s risk exposure and can obscure whether the detector itself contributes value.
Testing incremental value
Compare with a long-base breakout that requires only a range limit, without curvature. If the parabolic fit adds nothing beyond trend and volatility, the simpler detector may be sufficient. Test a small set of reasonable smoothing settings rather than selecting the smoothest-looking chart by eye.
Use chronological splits and group overlapping windows into one region. Report exclusions caused by missing suitable stops, drawdown and time with capital committed. The methodological reference [3] does not validate this parabolic detector.
Recognition tests should cover a rounded U, a V, a nearly flat series, a vertex outside the allowed interval and a single outlier that distorts the fitted curve. Timing tests should show that no signal exists at the central low before the recovery side develops. A replay with additional future bars must leave earlier candidates and their frozen reaction levels unchanged. For inverse patterns, swap high and low correctly when transforming price signs.
Common pitfalls
Smoothing creates the pattern
Inspect raw prices and residuals to see whether the curve conceals large shocks.
Buying at the center in a retrospective test
The right side did not yet exist, so calling the pattern complete there introduces look-ahead.
Many overlapping windows inflate the sample
One base can fit numerous lengths. Use a declared selection and grouping policy.
Checklist before using this method
Check each item after verifying it on your data. Progress is saved in this browser; it does not certify a profitable strategy.
Frequently asked questions
How is a rounding bottom different from a cup and handle?
A rounding bottom does not require a smaller handle at the end. A cup-and-handle strategy adds that structure and potentially a closer protective level.
Is a parabola mandatory?
No. A three-segment fit or pivot-based detector can be tested. Each is a separate implementation; do not choose between them retrospectively for individual winners.
Research sources
Each source supports the definition or evidence described beside it. The pseudocode, synthetic examples and proposed parameters require separate validation.
- StockCharts ChartSchool: Rounding BottomStockCharts. Rounding-bottom phases, confirmation and volume description; the public explanation was read. Checked: .
- TradingView: RepaintingTradingView. Pivot confirmation delay and repainting. Checked: .
- Lo, Mamaysky, Wang: Foundations of Technical AnalysisNBER / Columbia University. Background on systematic pattern research; this configuration is not tested by the paper. Checked: .
Related methods
Risk note
This content supports education and research design, not financial advice. Backtest is historical simulation, does not guarantee future performance and does not place real trades. Methods in this library are not automatically features available in the app. See methodology and learning center.
Validate rules before risking real capital
Check app support, data and individual simulated trades; advanced detectors may require a separate implementation.
Download Backtest on the App Store