Article contents
- Evidence and scope
- Illustration
- Process
- A ratio is a coordinate, not a trade signal
- Select a leg whose anchors are already confirmed
- Linear levels and two very different stop policies
- Linear and logarithmic interpolation produce different numbers
- Separate the touch, trigger and exit hypothesis
- Test pullback volume rather than narrating it
- Use equal-width controls and retain missed opportunities
- Common pitfalls
- Practical checklist
- Frequently asked questions
- Research sources
Evidence and scope
CME, Fidelity and TradingView explain construction and drawing conventions. They do not establish universal net profitability or a fixed reversal probability for Fibonacci levels.
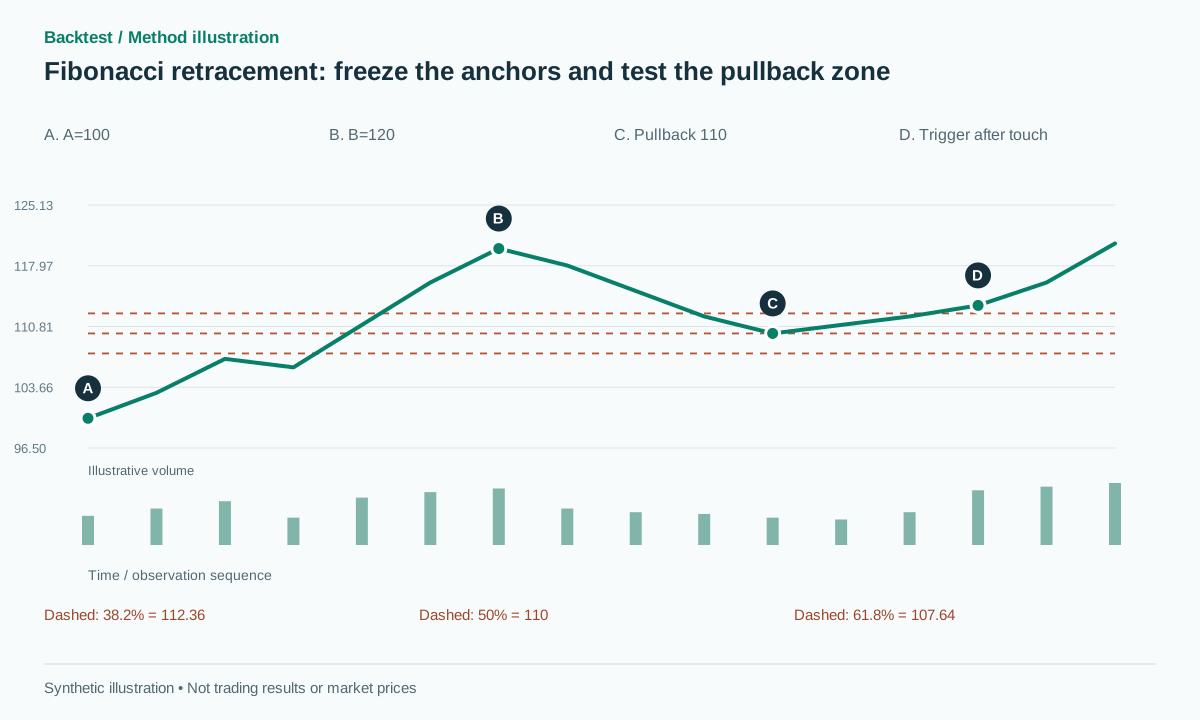 Open full-size illustration
Practical workflow
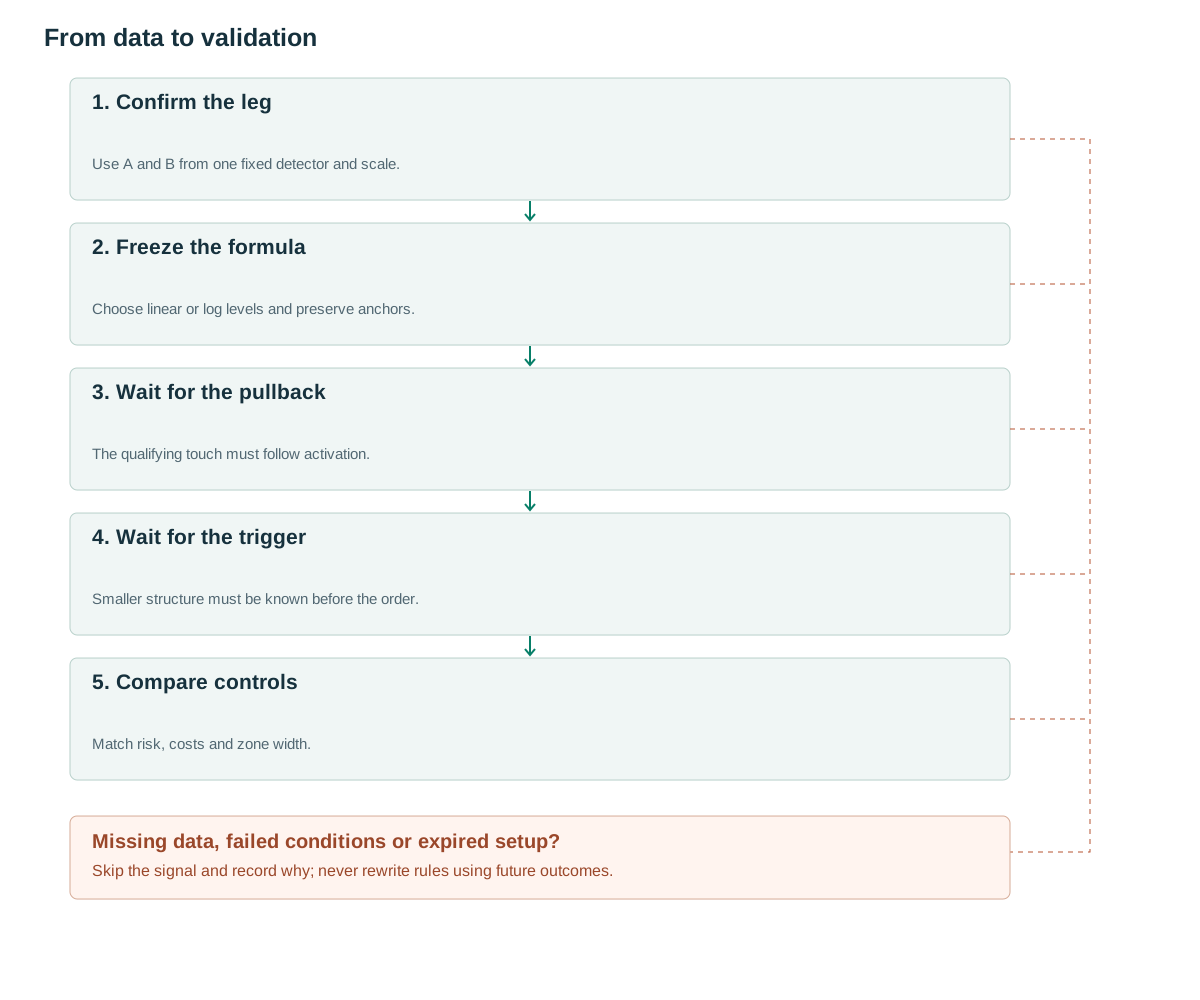
- Confirm the legUse A and B from one fixed detector and scale.
- Freeze the formulaChoose linear or log levels and preserve anchors.
- Wait for the pullbackThe qualifying touch must follow activation.
- Wait for the triggerSmaller structure must be known before the order.
- Compare controlsMatch risk, costs and zone width.
A ratio is a coordinate, not a trade signal
CME discusses 38.2% and 61.8% and notes that50%, although commonly plotted alongside them, is not a Fibonacci ratio [1]. Fidelity describes levels constructed between two extremes [2]. Treat these as candidate features describing pullback depth rather than assigning them guaranteed predictive meaning.
A chart offers many possible A→B pairs, creating numerous levels near the current price. Retaining only the pair from which price subsequently bounced makes the conclusion impossible to reproduce. The central modeling problem is deciding which leg is eligible before the reaction is known.
A useful experiment distinguishes the value of a pullback setup from the value of specific numerical ratios. If an ordinary nearby zone performs similarly with the same anchors, trigger and costs, the evidence favors the broader pullback concept rather than a special property of Fibonacci coordinates.
Select a leg whose anchors are already confirmed
The proposed baseline chooses A as a confirmed pivot low and B as the next alternating confirmed pivot high at a registered scale. Require B>A and a leg amplitude of at least 3×ATR at A, an experimental threshold. Activate the candidate only after B's confirmed_at. A historical touch that happened before activation cannot become a retrospective entry.
For an upward leg D=B−A, define F(r)=B−rD and freeze the research zone [F(0.618), F(0.382)]. For a downward leg, A is the high and B the low, with F(r)=B+r(A−B). Do not change either ratio or anchor to keep an otherwise invalid setup alive.
Store anchor identities, occurrence and confirmation times, scale, price transformation, zone boundaries and expiry. The code below is a detector sketch: invalidation or expiry must terminate processing for that candidate before any trigger branch can execute on the same bar.
If several eligible legs overlap, choose a deterministic policy such as the latest completed leg at one scale, or retain all observations with one-position-per-instrument risk handling. Trying every pair and counting only successful reactions would inflate both opportunity selection and apparent sample size.
when B becomes confirmed:
    A = preceding_confirmed_opposite_pivot(B)
    if A is None or ATR[A.i] is missing or ATR[A.i] <= 0: return
    if B.price <= A.price or B.price-A.price < 3*ATR[A.i]: return
    lower = B.price - 0.618*(B.price-A.price)
    upper = B.price - 0.382*(B.price-A.price)
    freeze(A,B,lower,upper,expires_in=20)
for each later closed bar t:
    if C[t] < A.price-buffer or expired(t):
        invalidate(); continue
    if low[t] <= upper and high[t] >= lower: mark_zone_touch(t)
    if touched and C[t] > frozen_micro_high+buffer: signal_long(t)
# frozen_micro_high must be known when the touch setup is activated.
Linear levels and two very different stop policies
Synthetic A=100, B=120 gives D=20. The 38.2% level is 112.36, the 50% level110, and 61.8% level107.64. A pullback to 111 lies inside the zone. Suppose a previously known micro high is 113 and a later close 113.3 triggers entry. A fill113.4 with stop 109.8 has 3.6 points of price risk and a 2R target 120.6.
A synthetic continuation above 120.6 before the stop satisfies that target. A failure moves through 109.8 and continues toward 100. If the stop is instead below the original A at 99.8, risk becomes 13.6 and the 2R target 140.6. Those are materially different strategies; a chart cannot retain the same displayed reward-to-risk while moving the stop between them.
If B is not confirmed until price has already fallen to 106 and recovered to 113, the strategy could not have bought the earlier110 touch. Reject that stale opportunity or register a distinct late-entry approach. Report the share of legs lost to confirmation delay rather than quietly removing them from the sample.
Include a gap across the entire zone as a fixture. A daily high–low range intersecting the zone does not establish a tradable touch at every level during a gap. A limit-order variant needs executable-price and fill assumptions separate from the completed-bar touch label.
Linear and logarithmic interpolation produce different numbers
TradingView provides a logarithmic Fibonacci calculation option for log-scale charts [3]. For positive prices, a transparent log definition is F_log(r)=exp(log(B)−r(log(B)−log(A))). This interpolates log prices. Merely changing how a chart is displayed does not alter a linear calculation unless the tool's level formula changes as well.
With A=100 and B=400, the 50% linear retracement is 250, while the logarithmic midpoint is 200. The difference can change the entire signal population. Choose the transformation before evaluation and store it in each candidate; log levels are undefined for zero or negative prices.
A reproducibility test should calculate both versions from the same anchors and verify their endpoints: r=0 returns B and r=1 returns A. Mirroring an upward leg into a downward leg should use the correct formula rather than reversing labels on an unchanged calculation.
Separate the touch, trigger and exit hypothesis
The proposed baseline waits for a zone touch and then a break of an already-known micro high. The candidate lasts 20 bars after activation and at most five bars after the touch. Entry uses a subsequent executable open; losing A before entry invalidates the setup. Permit one entry per leg. These timeouts are research settings.
Freeze the micro high when the touch setup activates. If that level is already crossed, define whether the candidate is stale rather than replacing it with a later convenient high. Likewise, a zone touched repeatedly should not generate unlimited independent trades without an explicit reset policy.
Measured-move projection is a different exit rule, projecting a leg length or pattern height from another reference. A projected target is not a destination price must reach. Compare structural targets,2R and time exits on development data, then preserve the selected version for final evaluation.
Use feasible fills around gaps and stops. If a price observed before order submission makes the planned trade unacceptable, a registered rejection policy can apply. A limit or stop order that has already filled remains in the ledger even if a later close makes the setup look invalid.
Test pullback volume rather than narrating it
Measure mean volume per bar during the pullback and the preceding advance, or divide total volume by duration. Unequal leg lengths make raw totals misleading. Lower pullback activity and higher trigger RVOL form a possible hypothesis, but its thresholds must be fixed before results are examined.
Run a same-anchor ablation: zone touch plus trigger, then add volume, then replace the Fibonacci zone with an ordinary40–60% zone. If performance is similar, the experiment provides more support for pullbacks generally than for the exact Fibonacci ratios.
For intraday legs, normalize activity by comparable session positions. A pullback across lunch can have lower volume without implying exhausted supply. Aggregate OHLCV cannot identify participant motives or assign every trade to a precise retracement price.
Use equal-width controls and retain missed opportunities
The 38.2–61.8% zone spans 23.6% of the leg;40–60% spans 20%. Different width changes touch probability, so add a same-width control such as38.0–61.6% and analyze returns as a function of continuous pullback depth. Comparing only the number of bounces is not a fair test.
Retain every eligible leg, including those never touching the zone or never triggering afterward. Fixtures should include delayed anchor confirmation, gaps across the region, overlapping setups sharing anchors and tick-size changes. Confirm prefix invariance for already-published candidates.
Report net expectancy, no-fill rate, holding time, exposure and sensitivity to nearby boundaries. A single bounce at 61.8% is an illustration rather than a statistical test. Register all anchor scales, ratios and stop alternatives so selecting the best historical combination does not disappear from the evidence record.
Common pitfalls
Trying every anchor pair after the reaction
Enough retrospective pairs can place a level near almost any observed bounce.
Treating a target as guaranteed
A projection is an exit hypothesis requiring empirical evaluation.
Changing chart scale without documenting calculation
Log and linear interpolation can differ substantially for large legs.
Checklist before using this method
Check each item after verifying it on your data. Progress is saved in this browser; it does not certify a profitable strategy.
Frequently asked questions
Is 61.8% stronger than 50%?
The reviewed sources do not establish a universal net advantage. Compare equivalent context, zone width and costs rather than selected examples.
Why not place a limit directly at a Fib level?
A limit-entry version can be tested separately, including missed fills, queue effects and moves through the zone. Waiting for a later price trigger tests another hypothesis.
Research sources
Each source supports the definition or evidence described beside it. The pseudocode, synthetic examples and proposed parameters require separate validation.
- Fibonacci Retracements and ExtensionsCME Group. Read retracement ratios and the distinction concerning 50%; examples are not treated as profitability tests. Checked: .
- Fibonacci RetracementFidelity. Read construction from two extrema. Checked: .
- Fibonacci retracement drawing toolTradingView. Read anchors, configurable levels and logarithmic calculation. Checked: .
Related methods
Risk note
This content supports education and research design, not financial advice. Backtest is historical simulation, does not guarantee future performance and does not place real trades. Methods in this library are not automatically features available in the app. See methodology and learning center.
Validate rules before risking real capital
Check app support, data and individual simulated trades; advanced detectors may require a separate implementation.
Download Backtest on the App Store