Article contents
- Evidence and scope
- Illustration
- Process
- Swing duration is determined by events
- Freeze the volatility threshold when a leg begins
- Numerical confirmation and failed trading outcomes
- A detector does not choose between continuation and reversal trading
- Compare volume without confusing activity and duration
- Test sensitivity and initialization effects
- Common pitfalls
- Practical checklist
- Frequently asked questions
- Research sources
Evidence and scope
The references explain directional change, ZigZag behavior and ATR. The close-only detector with one frozen threshold per leg is an independent implementation proposal, not a profitability result or an exact copy of a published indicator.
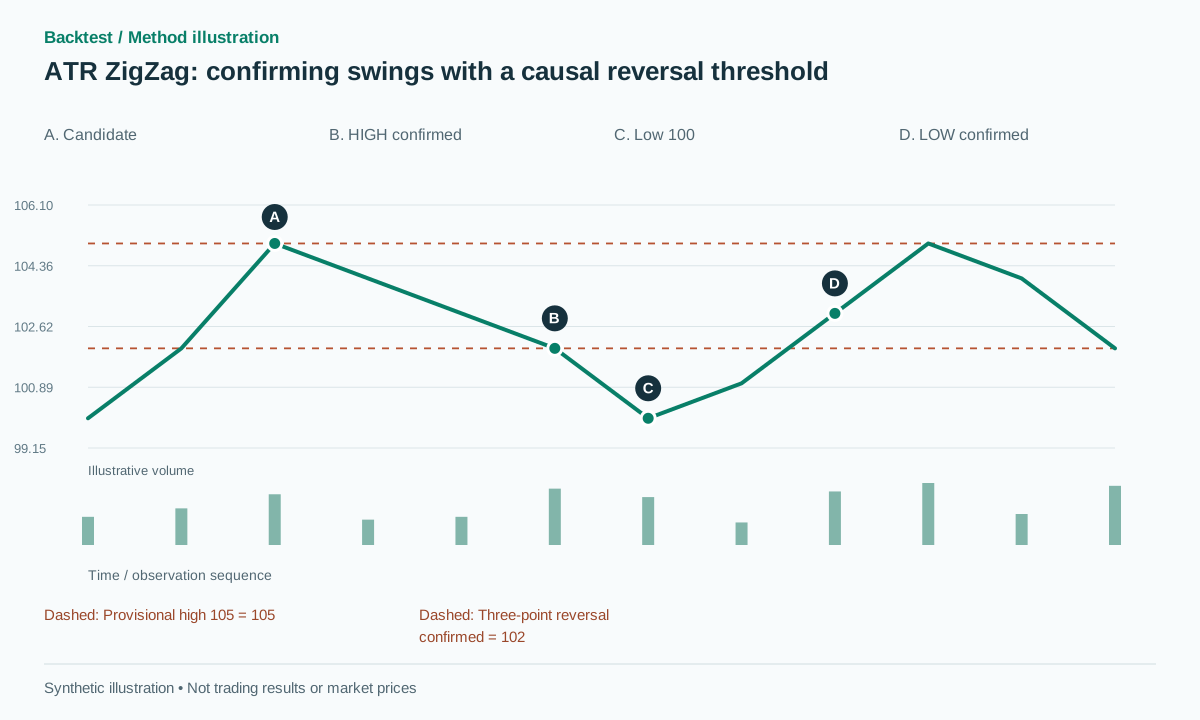 Open full-size illustration
Practical workflow
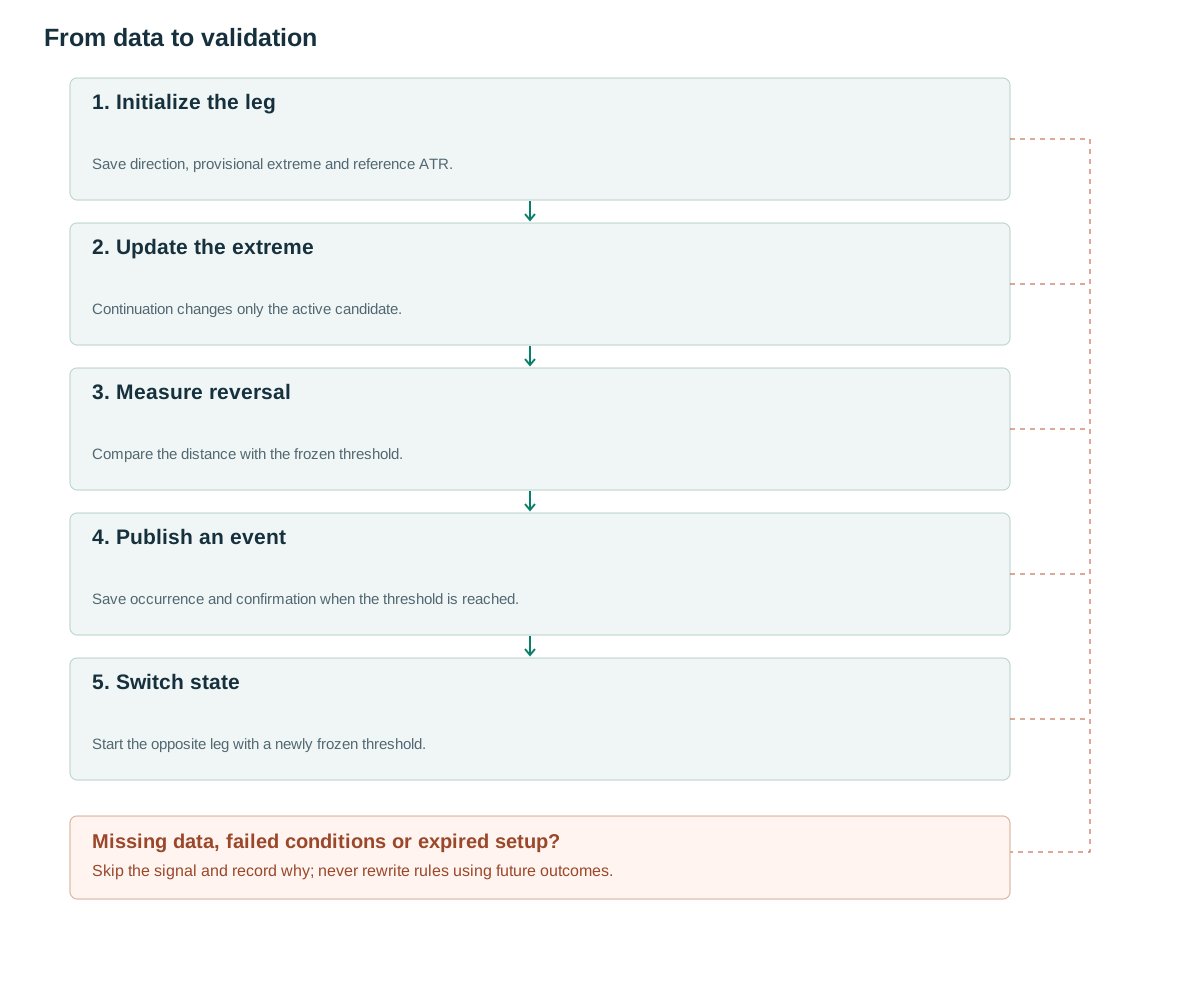
- Initialize the legSave direction, provisional extreme and reference ATR.
- Update the extremeContinuation changes only the active candidate.
- Measure reversalCompare the distance with the frozen threshold.
- Publish an eventSave occurrence and confirmation when the threshold is reached.
- Switch stateStart the opposite leg with a newly frozen threshold.
Swing duration is determined by events
An upward leg can last three bars or thirty. The engine keeps the highest close observed during the active leg but confirms that high only after a sufficiently large decline. Confirmation delay is therefore variable, unlike a fixed right-hand pivot window. Raising the threshold ignores more small fluctuations while usually recognizing turning points later.
Intrinsic-time research describes directional change through percentage thresholds [1]. TradingView's ZigZag has its own pivot construction and can revise its final segment [2]. This article instead specifies an immutable stream of confirmed events, with the current candidate stored separately. A changing provisional endpoint is acceptable when it is explicitly provisional; presenting it as a historical trade signal is not.
The detector labels a completed movement under its rules. It does not claim that a confirmed high is the highest price the market will ever reach. Price can reverse again immediately. Separate event detection, trend interpretation and trade management in both code and reporting so correctness at one layer cannot be mistaken for success at another.
Freeze the volatility threshold when a leg begins
The proposed rule takes A_ref from ATR14 on the bar immediately before the new leg begins and keeps q×A_ref unchanged throughout that leg. q=2 is a research setting. Define true range and the chosen smoothing method explicitly; ATR implementations can use different smoothing conventions [3]. Recomputing the threshold every bar would create a different detector.
A long-lasting leg can carry a threshold from an earlier volatility regime. That is a deliberate tradeoff for a stable rule, not proof that freezing is economically superior. If adaptive thresholds are studied, register that version separately and save each threshold update. Never replace historical thresholds with the latest ATR when rendering a completed chart.
The baseline uses closes to avoid inventing the order of a bar's high and low. Initialize UP at the first close after warm-up and do not label that starting value a confirmed low. Upon switching to DOWN, the current close becomes the provisional low. If the required ATR is missing or nonpositive, suspend detection until the initialization requirements are satisfied.
state = UP; extreme = first_close; extreme_i = first_i
threshold = q * ATR[first_i-1]
for each closed bar t after first_i:
    if state == UP:
        if C[t] > extreme: extreme, extreme_i = C[t], t
        elif extreme - C[t] >= threshold:
            emit HIGH(extreme_i, confirmed_at=t, price=extreme)
            state = DOWN; extreme, extreme_i = C[t], t
            threshold = q * ATR[t-1]
    else:
        if C[t] < extreme: extreme, extreme_i = C[t], t
        elif C[t] - extreme >= threshold:
            emit LOW(extreme_i, confirmed_at=t, price=extreme)
            state = UP; extreme, extreme_i = C[t], t
            threshold = q * ATR[t-1]
Numerical confirmation and failed trading outcomes
Synthetic example: A_ref=1.5 and q=2 require a three-point reversal. Closes follow 100→102→105→104→103. The high at 105 is still provisional because the drawdown is only two points. A subsequent close at 102 emits HIGH with price 105, occurrence at the third observation and confirmation at the sixth.
Replace that final close with 106 and the provisional high moves to 106. There is no deleted short signal because nothing was confirmed. After a confirmed decline to 102, suppose the DOWN leg reaches 100 and rebounds to 103, with its own frozen threshold also equal to three. The low at 100 is confirmed at 103. The finished line connects attractive extremes, while actual decisions became possible at 102 and 103.
Trading can still fail after correct detection. A proposed short entered at the following open of 101.8, with a stop at 105.2, has 3.4 points of planned price risk. If price rebounds to 106, the structural hypothesis fails and the stop may slip. Do not classify this as a detector error; the directional-change event occurred, but continuation did not follow.
Boundary tests should include a reversal exactly equal to the threshold, one tick below it and one tick beyond it. Fix whether equality confirms, as this baseline does. Also test equal repeated extremes: the current implementation retains the earlier occurrence timestamp because it updates only on a strictly greater high or strictly lower low.
A detector does not choose between continuation and reversal trading
Two separate hypotheses are possible: follow the newly confirmed directional change, or trade against it. A proposed baseline follows it at the next executable open, stops beyond the just-confirmed extreme and exits on the opposite directional change. Do not select between the two interpretations separately for each historical chart segment.
A structural stop may be far away by confirmation. Size must reflect the actual entry-to-stop distance plus estimated costs and portfolio constraints. Reject uneconomic setups only using information available before submission. If a resting order has already filled through a gap, the trade cannot be retrospectively removed because its risk became unattractive.
Percentage thresholds need their own denominator convention: a decline is (peak−C)/peak, while a rise is (C−trough)/trough. These are not symmetric in log-return space. A log-price difference can create a symmetric alternative for strictly positive prices. Ordinary ratios are unsuitable when the reference is zero or negative.
An execution test should replay a sudden move across more than one threshold within a bar. The close-only baseline emits at most the event supported by its state transition at that close; it cannot reconstruct every intrabar swing. A tick-based version may produce more events, which is a change of input resolution rather than evidence that the close implementation is incorrect.
Compare volume without confusing activity and duration
A longer leg often has greater total volume simply because it contains more observations. Save total volume, bar count, mean volume and price displacement together. A proposed effort feature divides volume by max(displacement, tick), but a large ratio alone does not establish absorption or identify participants.
At a confirmed HIGH, activity from extreme_i+1 through confirmed_at belongs to the observed reversal interval. Keep it separate from volume accumulated before the extreme, and fix which segment owns the extreme bar. Although the boundary becomes clear at confirmation, the resulting feature cannot be used as if known at the earlier extreme.
One useful ablation adds same-time RVOL at confirmation while retaining identical entry, stop and sizing rules. Examine whether it improves net returns within volatility groups or merely selects fast bars with wider spreads. Record rejected signals and missing volume so a change in opportunity count is not hidden by reporting only completed trades.
Test sensitivity and initialization effects
Register a small q grid such as 1.5, 2 and 3, select only on development data and freeze the choice before the final test. Report event count, time out of the market, confirmation delay in both bars and ATR units, and the frequency of gaps through stops. Performance that survives only at q=2.03 but disappears at 2.0 and 2.1 deserves investigation.
Prefix replay must preserve every emitted HIGH and LOW even while the current provisional extreme moves. Save state, extreme timestamp, A_ref and threshold with each event. Starting the replay earlier tests sensitivity to initialization and warm-up; otherwise the arbitrary first direction can influence an unexpectedly long section of history.
Compare frozen and continuously adaptive thresholds as different registered models. Also inspect high-volatility transitions where the frozen threshold may produce many events after a quiet period, and quiet transitions where it may produce very few. These diagnostics explain behavior; selecting a favorable regime after seeing returns would introduce another research trial.
Common pitfalls
Trading from the unfinished last segment
A provisional endpoint can move. Keep it out of the confirmed historical signal stream.
Future ATR improves earlier swings
Store the contemporaneous reference ATR instead of recalculating old thresholds from later volatility.
Mixing wicks and closes opportunistically
Using wicks for attractive extremes but closes to avoid stops creates inconsistent information and execution rules.
Checklist before using this method
Check each item after verifying it on your data. Progress is saved in this browser; it does not certify a profitable strategy.
Frequently asked questions
Is ATR ZigZag better than percentage ZigZag?
That is an empirical hypothesis. ATR adapts the scale but introduces a lookback, smoothing convention and threshold-freezing policy that also need testing.
Can price make a higher high after HIGH is confirmed?
Yes. HIGH describes a completed leg under the detector's rule, not the market's final top or a guaranteed downward forecast.
Research sources
Each source supports the definition or evidence described beside it. The pseudocode, synthetic examples and proposed parameters require separate validation.
- The Theory of Intrinsic Time: A PrimerJames B. Glattfelder and Richard B. Olsen. Read directional change and multiple scales; this is not a backtest of the proposed ATR variant. Checked: .
- Zigzag indicatorTradingView. Read construction, projected pivots and limitations of the final segment. Checked: .
- Average True RangeTradingView. Read true range and smoothing choices. Checked: .
Related methods
Risk note
This content supports education and research design, not financial advice. Backtest is historical simulation, does not guarantee future performance and does not place real trades. Methods in this library are not automatically features available in the app. See methodology and learning center.
Validate rules before risking real capital
Check app support, data and individual simulated trades; advanced detectors may require a separate implementation.
Download Backtest on the App Store