Article contents
- Evidence and scope
- Illustration
- Process
- Abnormal activity is relative to the stock itself
- A full-day signal becomes available after the day ends
- Build comparable high- and low-volume cohorts
- A touched limit price does not prove a fill
- Synthetic premium, costs and an unsuccessful cohort
- Tests that separate the signal from the trading design
- Common pitfalls
- Practical checklist
- Frequently asked questions
- Research sources
Evidence and scope
The inspected working paper reports positive high-minus-low return premiums and a TAQ limit-order exercise. Its 0.89% and 0.73% figures for two size groups are per dollar of long notional after modeled spread effects, excluding commission and impact; they are not net account returns. [1]
 Open full-size illustration
Practical workflow
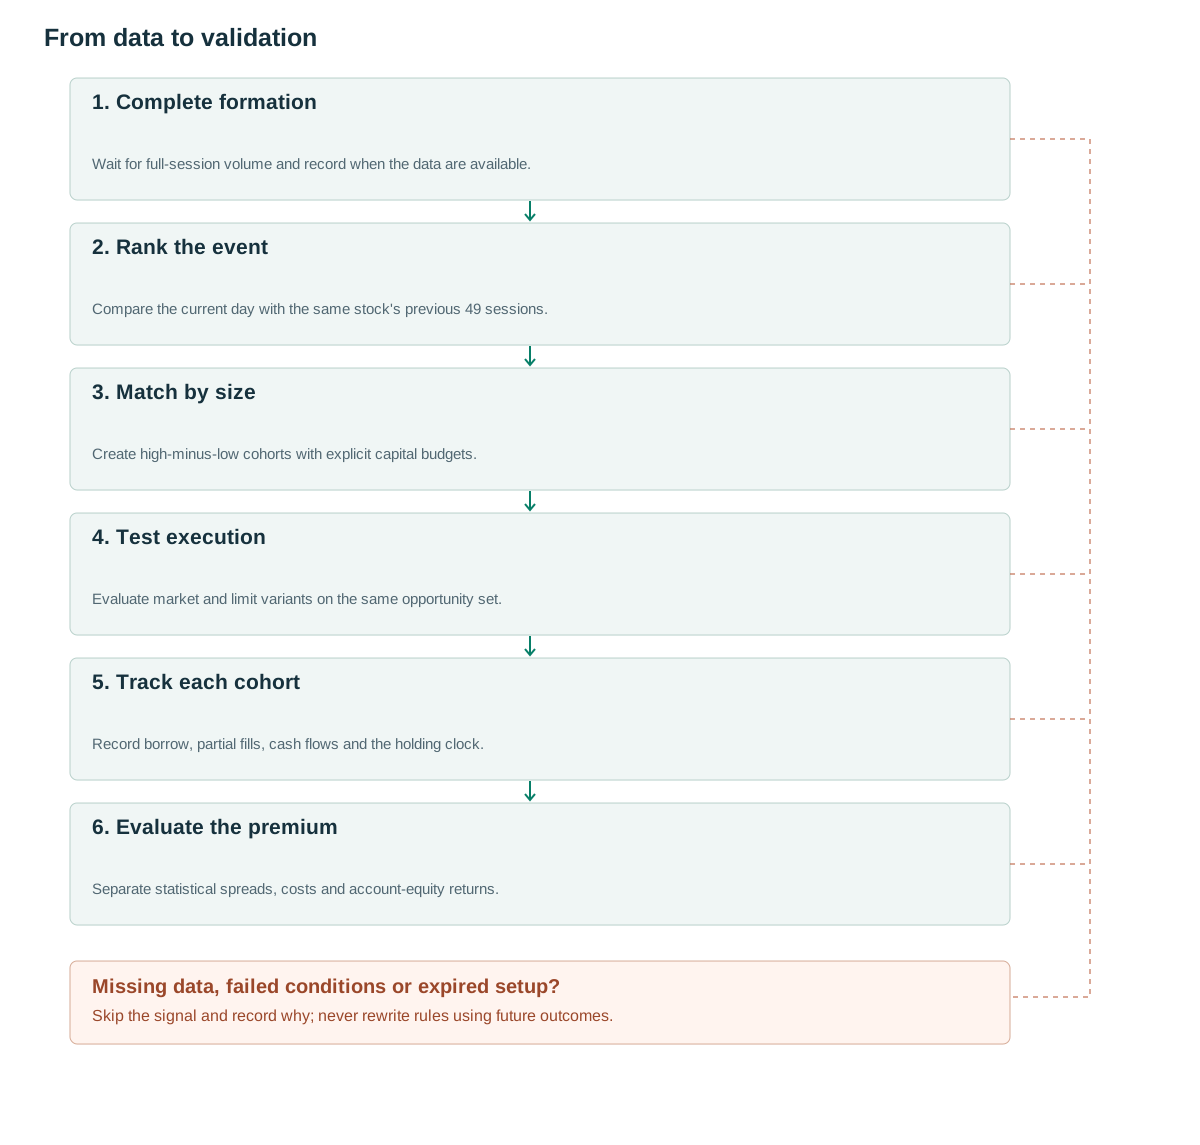
- Complete formationWait for full-session volume and record when the data are available.
- Rank the eventCompare the current day with the same stock's previous 49 sessions.
- Match by sizeCreate high-minus-low cohorts with explicit capital budgets.
- Test executionEvaluate market and limit variants on the same opportunity set.
- Track each cohortRecord borrow, partial fills, cash flows and the holding clock.
- Evaluate the premiumSeparate statistical spreads, costs and account-equity returns.
Abnormal activity is relative to the stock itself
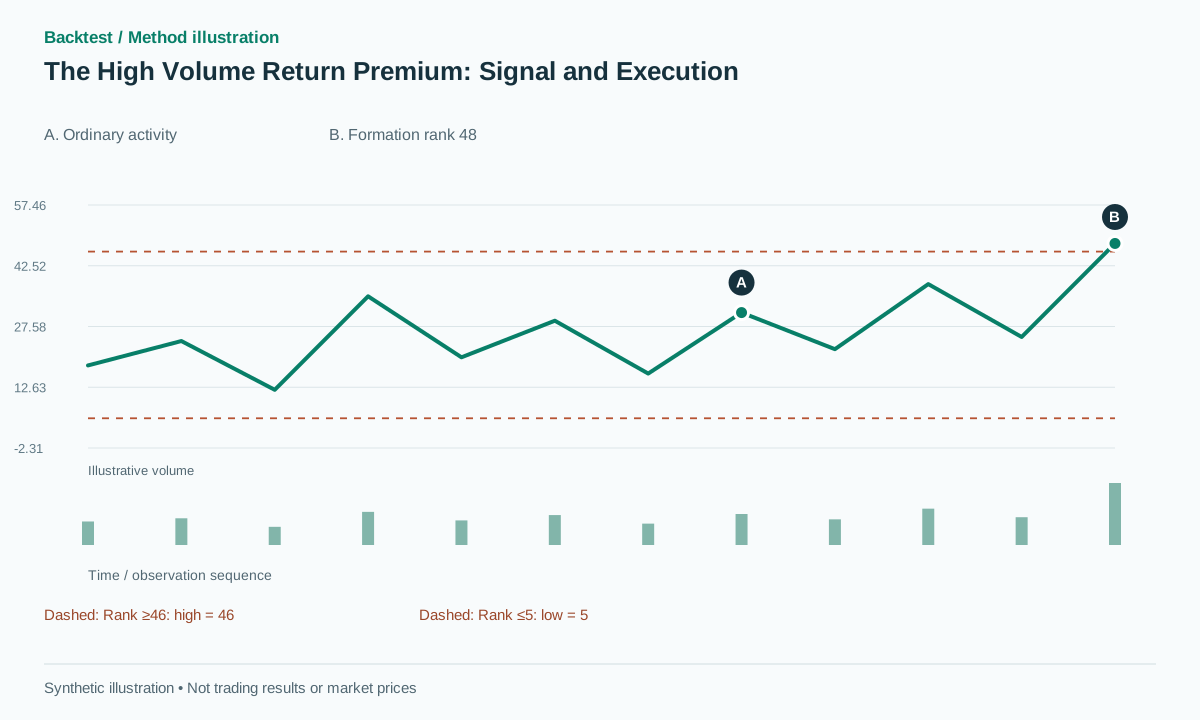
Raw trading volume makes large and small companies difficult to compare. This method asks a different question: how unusual is today's dollar trading volume for this particular stock? Rank the completed formation day's dollar volume among that day and the previous 49 sessions. With transaction data, dollar volume is the sum of trade price times shares; daily closing price times total shares is an approximation.
With ranks from 1 to 50, a proposed implementation labels rank 46 or higher as high volume and rank 5 or lower as low volume. These represent the upper and lower deciles when all observations are distinct. Define tie handling explicitly; average ranks can leave a tied boundary group unclassified rather than forcing exactly five observations into each tail.
A synthetic stock with $40 million of dollar volume might rank 48 against its own history, while another trading $300 million might rank 25. The first is unusually active under this definition; the second is not. The method is therefore not a screen for the largest absolute turnover.
The original hypothesis concerns subsequent returns after an unusual activity event. It does not require that the formation day be bullish. Adding a positive candle, a resistance breakout or a VWAP condition creates another hypothesis and should be measured as an additional filter.
A full-day signal becomes available after the day ends
Formation-day dollar volume is not complete at the open or halfway through the session. The rank becomes usable only after the required observations have arrived. An intraday forecast of final volume is a different signal and cannot inherit the original event definition.
The historical study covers NYSE stocks from August 1963 through December 1996. Its principal formation schedule uses nonoverlapping 50-day intervals, while a proposed daily-scanning version would create many more overlapping events. [1] Retaining the same rank formula does not make those portfolio schedules identical.
Keep event time, data receipt time and final correction time separate. If an after-hours correction changes the rank from 45 to 48, record when that information became available. A research engine should not execute at the earlier closing price using the corrected classification.
Corporate actions and dollar-volume construction also need a fixed convention. Adjusted price multiplied by unadjusted share volume can distort activity around splits. Missing sessions, suspensions and incomplete history should trigger a declared eligibility rule rather than being filled with zeros.
Build comparable high- and low-volume cohorts
The proposed research design below forms size-matched high-minus-low cohorts after daily signal confirmation. It is an operational extension, not a claim to reproduce every schedule in the paper. Match group definitions before evaluating performance so that the comparison is not dominated by a difference in company size.
Use equal long and short notional within a matched cohort, reserve capital when orders are submitted and avoid opening another independent cohort for the same asset until the existing one closes. The last condition limits overlapping exposure in this proposal; removing it is a separate portfolio choice.
The proposed holding horizon is 20 sessions from the planned entry date, with a fixed limit-order deadline. Delayed or partial fills do not restart that clock or extend the opportunity indefinitely. Measuring from actual execution instead would be a different variant. Record unfilled quantities, borrow rejections, and failed cancellations even when no completed trade results.
Short-side borrow is a real constraint. A low-volume stock that cannot be borrowed should not disappear from the historical opportunity log. Record the rejection and apply the predeclared treatment to its matched long allocation. This preserves the difference between an attractive paper spread and an implementable account.
Keep membership, target notional, fill quantities, costs and exit dates in a cohort ledger. Net execution across cohorts is permissible, but account positions and cash flows must still reconcile with the attributed research returns.
after_formation_session(d):
    for asset in eligible_asof(d):
        values = dollar_volume[asset, d-49:d+1]
        rank = average_rank_of_last(values)
        label = HIGH if rank >= 46 else LOW if rank <= 5 else NORMAL
        freeze_signal(asset, label, available_at=data_ready_time)
    cohorts = build_size_matched_high_minus_low(signals)
    reserve_budget_for_cohorts(cohorts)
on_next_session():
    for order in eligible_orders:
        apply_borrow_and_participation_limits(order)
        execute_selected_model(order)  # market or limit variant
on_predefined_deadline():
    cancel_or_convert_unfilled_remainder()
on_cohort_horizon():
    liquidate_with_same_declared_execution_model()
A touched limit price does not prove a fill
The paper includes a 1993–1994 TAQ execution exercise with limit orders and fallback rules. [1] That motivates testing execution carefully; it does not establish that every limit order at a displayed price would receive a fill in a new implementation.
NYSE's TAQ product describes trades and quotes, including consolidated market information. [2] Such observations help reconstruct available prices, but a historical trade at a limit price does not reveal an individual order's queue position or guarantee sufficient executable quantity.
A synthetic buy limit at 20.00 may see one small trade at 20.00 before price rises to 20.80. Assuming the full order filled would select a favorable outcome without proving access to that liquidity. Conversely, a falling market may fill the order easily and then continue lower, producing adverse selection.
Compare two predeclared execution variants on the same opportunities: a market-style entry after signal availability, and a limit entry with a fixed cancellation or conversion deadline. For the limit version, specify eligible quotes, queue or participation assumptions, partial fills and the fallback price.
The SEC's order-type bulletin explains the distinction between a price constraint and execution certainty. [3] A limit order controls acceptable price, while a marketable order prioritizes execution under the available market conditions. Neither removes all uncertainty.
Report missed opportunities and filled trades separately. Evaluating only filled limit orders can hide whether the execution rule systematically misses the strongest subsequent moves or preferentially fills events that then reverse.
Synthetic premium, costs and an unsuccessful cohort
Suppose a matched cohort has $10,000 long in high-volume stocks and $10,000 short in low-volume stocks. The long leg gains 1.2%, earning $120, and the shorted assets fall 0.4%, earning $40. Gross profit is $160: 1.6% per dollar of initial long notional, or 0.8% on $20,000 of account equity.
Assume $70 of spread cost, $20 commission, $30 borrow expense and $5 of other explicitly identified costs. Total cost is $125, leaving $35, or 0.175% on the $20,000 equity denominator. If spread cost rises from $70 to $130, total cost becomes $185 and net profit becomes −$25.
In a failed cohort, the long leg falls 2% while the shorted assets rise 1%. The combined price loss is $300 before costs. Matching notional does not neutralize all sector, beta or liquidity risk, and a positive average premium does not prevent this outcome.
The inspected limit-order subsection reports 0.89% and 0.73% for small and medium groups under a particular normal-return branch. [1] Preserve both the branch and the per-dollar-long denominator. These figures should not be relabeled a universal monthly return, CAGR or fully costed portfolio result.
Tests that separate the signal from the trading design
First verify rank arithmetic with known sequences, ties, missing days and a split event. Confirm that adding future sessions cannot change a previously published signal except through an explicitly versioned data correction. This is a stronger causal test than inspecting a completed chart.
Next compare high, normal and low groups under the same eligibility and holding rules. Add size and liquidity controls before attributing differences to abnormal volume. If the high group simply contains smaller or harder-to-trade stocks, part of the apparent premium may reflect those exposures.
Keep the daily-scanning extension separate from a reproduction of the original nonoverlapping schedule. Overlapping positions create dependent observations and different capital demands. Report the number of formation events, unique instruments, active cohorts and realized account turnover.
Finally test market and limit execution on locked later data. Include commission, borrow and impact assumptions, show capacity sensitivity, and report gross premiums alongside net account returns. If the economic result disappears after realistic costs, the statistical signal may remain interesting without supporting a tradable strategy.
Do not infer continuous profitability from a historic positive average. The useful output is a documented relationship between event definition, market regime, implementation and uncertainty, including the conditions under which the result fails.
Common pitfalls
Replacing relative activity with largest absolute volume
A cross-sectional volume leaderboard answers a different question from ranking each stock against its own history.
Treating a limit touch as a complete fill
A printed trade does not prove queue priority or available quantity. This assumption can overstate favorable fills.
Calling a spread-adjusted premium fully net
Commission, market impact, borrow and capital requirements can remain outside a reported execution exercise.
Checklist before using this method
Check each item after verifying it on your data. Progress is saved in this browser; it does not certify a profitable strategy.
Frequently asked questions
Does the formation day need to close higher?
Not for the basic volume-rank event. A positive-return requirement is an additional filter and must be tested separately.
Can I scan every day instead of every 50 days?
Yes, as a new portfolio design. Daily scanning changes overlap, dependence, turnover and capital usage, so it is not an exact replication of the original schedule.
Research sources
Each source supports the definition or evidence described beside it. The pseudocode, synthetic examples and proposed parameters require separate validation.
- The High Volume Return PremiumSimon Gervais, Ron Kaniel, Dan Mingelgrin — working paper 17/12/1998. Working paper dated 17 December 1998 read, including the TAQ limit-order exercise. Its scope and conventions are distinguished from the later journal publication; no backtest was rerun. Checked: .
- Daily TAQNYSE / ICE. Primary product documentation read for available trade and quote data. It does not provide a guarantee of individual-order queue position. Checked: .
- Understanding Order Types — Investor BulletinU.S. SEC — Investor.gov. Primary investor bulletin read for market, stop and limit-order mechanics; it is not evidence of the volume premium. Checked: .
Related methods
Risk note
This content supports education and research design, not financial advice. Backtest is historical simulation, does not guarantee future performance and does not place real trades. Methods in this library are not automatically features available in the app. See methodology and learning center.
Validate rules before risking real capital
Check app support, data and individual simulated trades; advanced detectors may require a separate implementation.
Download Backtest on the App Store