Article contents
- Evidence and scope
- Illustration
- Process
- Why turnover can change the interpretation of momentum
- Independent ranks produce the intended intersections
- Point-in-time data and the universe need separate checks
- Overlapping cohorts turn signals into a portfolio
- Return denominators change the apparent percentage
- Test incremental information, not a renamed benchmark
- Common pitfalls
- Practical checklist
- Frequently asked questions
- Research sources
Evidence and scope
The study reports first-year event-time returns of 16.70% for early momentum, 12.49% for simple momentum and 6.84% for late momentum. These are raw research portfolio figures, not net account CAGR. [1]
 Open full-size illustration
Practical workflow
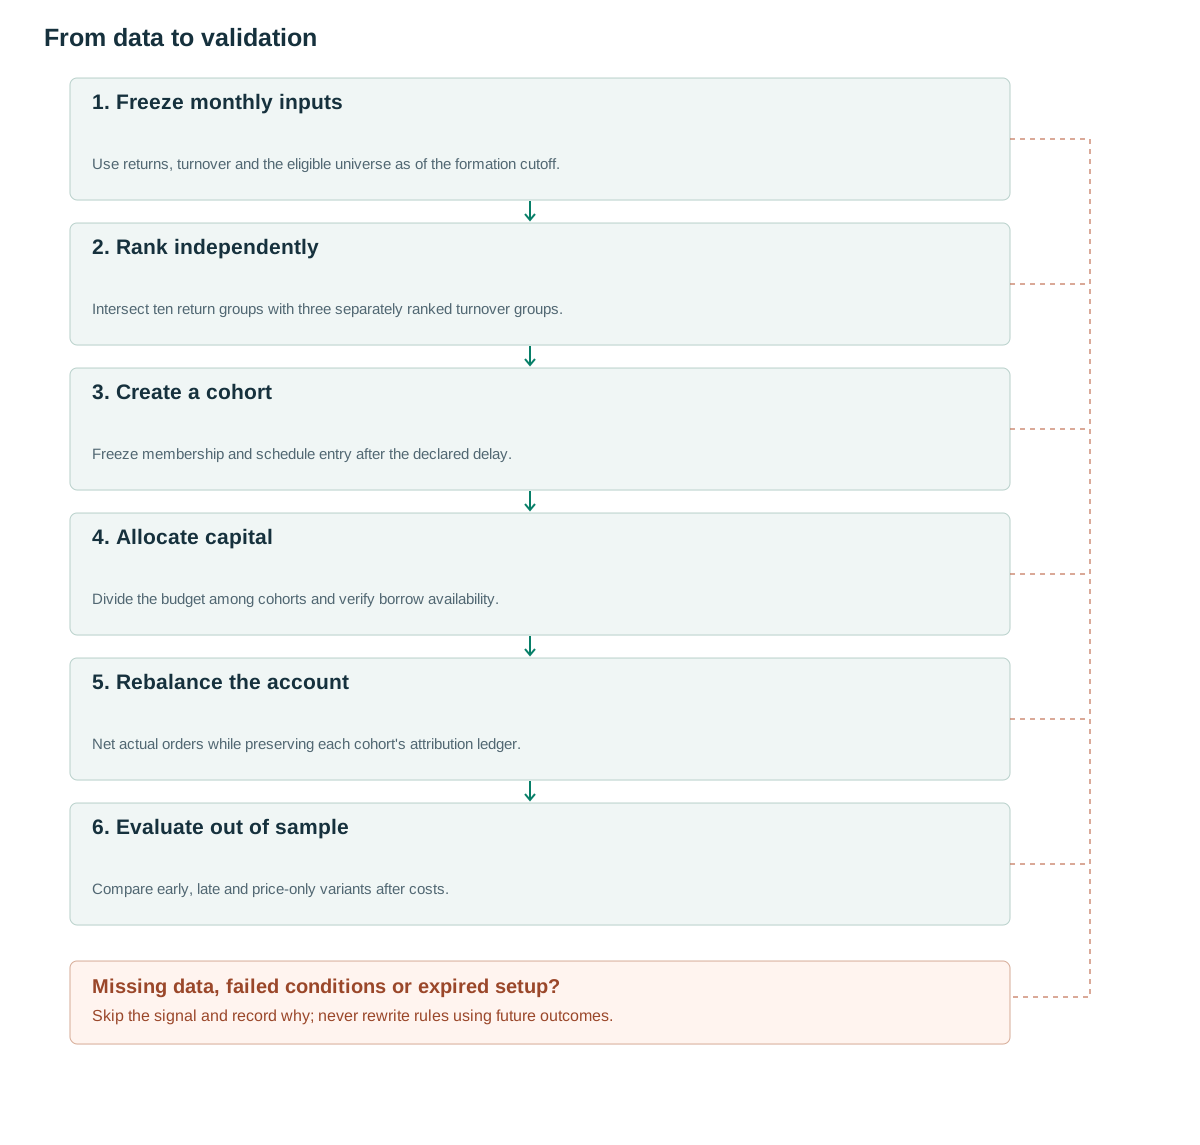
- Freeze monthly inputsUse returns, turnover and the eligible universe as of the formation cutoff.
- Rank independentlyIntersect ten return groups with three separately ranked turnover groups.
- Create a cohortFreeze membership and schedule entry after the declared delay.
- Allocate capitalDivide the budget among cohorts and verify borrow availability.
- Rebalance the accountNet actual orders while preserving each cohort's attribution ledger.
- Evaluate out of sampleCompare early, late and price-only variants after costs.
Why turnover can change the interpretation of momentum
Price momentum ranks assets by their past returns. Turnover adds a measure of trading activity relative to the shares outstanding. The joint classification asks whether the same price performance has different subsequent behavior when participation has been relatively low or high.
Daily share turnover is trading volume divided by shares outstanding for that day. A synthetic stock trading one million shares with 100 million shares outstanding has 1% turnover. Following a two-for-one split, two million shares traded against 200 million outstanding still gives 1%. Raw volume doubles, but the participation ratio does not.
The study distinguishes early momentum, buying low-turnover winners and shorting high-turnover losers, from late momentum, buying high-turnover winners and shorting low-turnover losers. [1] These labels describe portfolio classifications. They do not identify the psychological stage of a particular stock with certainty.
An individual high-turnover winner can continue rising, and a low-turnover winner can reverse. The method concerns differences between conditional groups, so anecdotes about one spectacular stock neither validate nor refute the portfolio effect. The implementation must preserve the complete eligible cross-section.
Independent ranks produce the intended intersections
At a formation cutoff, calculate six-month total return and average daily turnover over the chosen six-month window. Independently divide return into ten groups and turnover into three groups, then intersect their memberships. Ranking turnover separately inside each return decile would be a conditional sort and can produce different stocks.
The early-momentum long leg contains the top return decile and bottom turnover tercile; the short leg contains the bottom return decile and top turnover tercile. The late variant reverses the turnover selections while retaining the return extremes. A price-only benchmark ignores turnover but should otherwise use comparable formation and holding rules.
Fix tie handling and minimum observations before the test. A stable identifier can break exact ties, or average ranks can be converted into deterministic bins. Neither method should use subsequent returns. Sparse intersections also require a declared response: retain cash, reduce exposure or skip the cohort according to a fixed rule.
Use the information actually available at the cutoff. Shares outstanding may arrive on a different schedule from exchange volume. A final revised share count joined backward to every historical day can alter turnover ranks with information that was not yet known.
Point-in-time data and the universe need separate checks
The original sample spans NYSE and AMEX over 1965–1995. Its historical construction includes exclusions that should be examined before calling a modern implementation fully point-in-time; for example, an exclusion based on delisting shortly after formation uses a subsequently observed event. [1]
A proposed tradable replication should retain instruments eligible at formation and then process delisting proceeds, suspensions and corporate events when they occur. It should not pre-remove an eventual loss because the stock is absent from today's database. Stable identifiers are necessary when symbols change or are reused.
CRSP documents fields for prices, volume, shares and corporate events. [2] Having these fields does not automatically make every join causal. Record publication or availability dates where relevant, the return convention and treatment of missing or stale prices.
Total return and price return are different ranking inputs. Dividends, splits and distributions should be handled consistently across the universe and benchmark. Also decide how much history a newly listed stock needs before entering the formation set; silently padding a short history creates incomparable rankings.
Overlapping cohorts turn signals into a portfolio
The following is a proposed operational design, not an exact reproduction of every convention in the source. Each month forms a fixed-membership cohort, waits five trading sessions, then holds for 12 months. Each new cohort receives one twelfth of the available strategy equity budget, with matched long and short notional. The paper's one-week lag should not be assumed identical to every five-session implementation.
During startup, unallocated cohort budgets remain in cash under this proposal. Filling all 12 budgets immediately with the first cohort would materially change exposure. At maturity, up to 12 cohorts coexist, and an instrument can belong to several cohorts with different planned exits.
Keep a cohort ledger even if the broker executes only the net desired position. A purchase for one cohort may offset a sale for another; the account's actual turnover can be lower than the sum of notional cohort turnover. Allocate fills and costs consistently so that attribution reconciles to the real account.
Borrow constraints cannot be solved by deleting unavailable shorts after seeing their returns. Predefine whether an unavailable short reduces the matched long allocation, leaves a cash imbalance or uses an explicitly tested substitute. Include borrow fees, recalls and forced closes.
Because membership is fixed at formation, an asset's later rank does not remove it from a cohort unless an additional exit rule was registered. Monthly reranking with full portfolio replacement is a different strategy.
Enforce a maximum of 12 active cohort slots. If a new entry would arrive before the oldest scheduled exit, retain its reserved budget in cash until a slot is released rather than temporarily exceeding the cap. Short-position costs also include dividend compensation owed to the lender when applicable.
on_month_cutoff(t):
    universe = eligible_asof(t)
    momentum = six_month_total_return(universe, t)
    turnover = mean_daily_volume_over_shares(universe, t)
    r_group = independent_rank(momentum, bins=10)
    v_group = independent_rank(turnover, bins=3)
    long_ids = ids_where(r_group == 10 and v_group == 1)
    short_ids = ids_where(r_group == 1 and v_group == 3)
    cohort = freeze_membership(long_ids, short_ids, cutoff=t)
    schedule_entry(cohort, after=5_trading_sessions, budget=equity/12)
    schedule_exit(cohort, after_entry=12_months)
on_execution():
    apply_borrow_and_capacity_rules()
    trade_net_target_changes()
    allocate_fills_and_costs_to_cohorts()
Return denominators change the apparent percentage
Consider a synthetic cohort with $10,000 long and $10,000 short. The long leg gains 8%, generating $800, and the shorted assets fall 3%, generating $300 before costs. The combined profit is $1,100. That is 11% per dollar of initial long notional, but 5.5% relative to $20,000 of equity if that is the chosen capital denominator.
Suppose trading, borrow and other declared costs total $220. Net profit becomes $880, or 4.4% on the same $20,000 denominator. A publication's long-minus-short return spread does not itself specify the margin, financing and cash management of a real account.
In a failed cohort, the long leg loses 6% while the shorted assets rise 10%. The losses are $600 and $1,000 respectively: −$1,600, or −8% of $20,000 before costs. Being long and short does not guarantee a small loss, especially when the legs have different sector or factor exposures.
The chart's vertical values are turnover percentages for separate stocks, not prices over time. Its secondary bars represent illustrative return groups, not traded share volume. This distinction matters because a cross-sectional ranking should not be interpreted as an intraday breakout sequence.
Test incremental information, not a renamed benchmark
Compare early momentum, late momentum and a price-only version using the same universe, return horizon, holding schedule, risk and cost assumptions. Otherwise, differences in weights or leverage can be mistaken for information supplied by turnover.
The French momentum factor is a useful external reference, but its formation and weighting differ from this six-month joint sort. [3] Matching its return series is not a direct replication target. State exactly which benchmark question it answers, such as broad exposure to a momentum factor.
Report returns by cohort and calendar month, gross and net exposure, sector concentration, turnover and borrow availability. Overlapping holding periods create dependent observations; treating every cohort-month as independent can overstate statistical confidence.
Use later locked periods and test nearby formation windows without selecting the best result after inspection. A robustness table should include all registered variations. A turnover effect that appears only with one boundary, one data treatment or a few inaccessible shorts deserves a narrower interpretation.
Finally, separate evidence of conditional return predictability from evidence of an executable portfolio. A raw long-minus-short premium may survive statistically while losing economic appeal after financing, impact and capacity constraints. Both outcomes are useful research conclusions.
Common pitfalls
Sorting turnover within each return group
This creates a conditional sort instead of the intended independent intersections and may select materially different stocks.
Calling a raw spread account CAGR
A long-minus-short portfolio statistic does not specify financing, capital requirements or compounding for a live account.
Ignoring dependence between overlapping cohorts
The same stock and market shocks can affect several cohorts. Statistical uncertainty must account for this repeated exposure.
Checklist before using this method
Check each item after verifying it on your data. Progress is saved in this browser; it does not certify a profitable strategy.
Frequently asked questions
Is high volume always a positive momentum filter?
No. The joint-sort hypothesis distinguishes different combinations of past returns and turnover. The direction of the classification is part of the method and must be tested.
Can the method be converted to daily signals?
That would be a new strategy with different formation, turnover and holding behavior. It requires its own cost model and untouched evaluation rather than inheriting the monthly study's evidence.
Research sources
Each source supports the definition or evidence described beside it. The pseudocode, synthetic examples and proposed parameters require separate validation.
- Price Momentum and Trading VolumeCharles M. C. Lee, Bhaskaran Swaminathan — Journal of Finance, 2000. Original Journal of Finance paper read. The reported first-year event-time figures are raw portfolio statistics; they are not claimed as net account CAGR. Checked: .
- CRSP US Stock DatabasesCRSP. Primary database documentation read for relevant fields and corporate-event handling. A valid point-in-time join remains the implementer's responsibility. Checked: .
- Detail for Monthly Momentum Factor (Mom)Kenneth R. French Data Library. Primary factor-construction documentation read. Its momentum horizon and weighting differ from the joint-sort specification discussed here. Checked: .
Related methods
Risk note
This content supports education and research design, not financial advice. Backtest is historical simulation, does not guarantee future performance and does not place real trades. Methods in this library are not automatically features available in the app. See methodology and learning center.
Validate rules before risking real capital
Check app support, data and individual simulated trades; advanced detectors may require a separate implementation.
Download Backtest on the App Store