Article contents
Evidence and scope
The cited material supports terminology and research context. The numerical thresholds, state machine, execution policy and synthetic examples below are proposed by this research project. No new backtest has been run, and the references do not establish profitability for this configuration.
 Open full-size illustration
Practical workflow
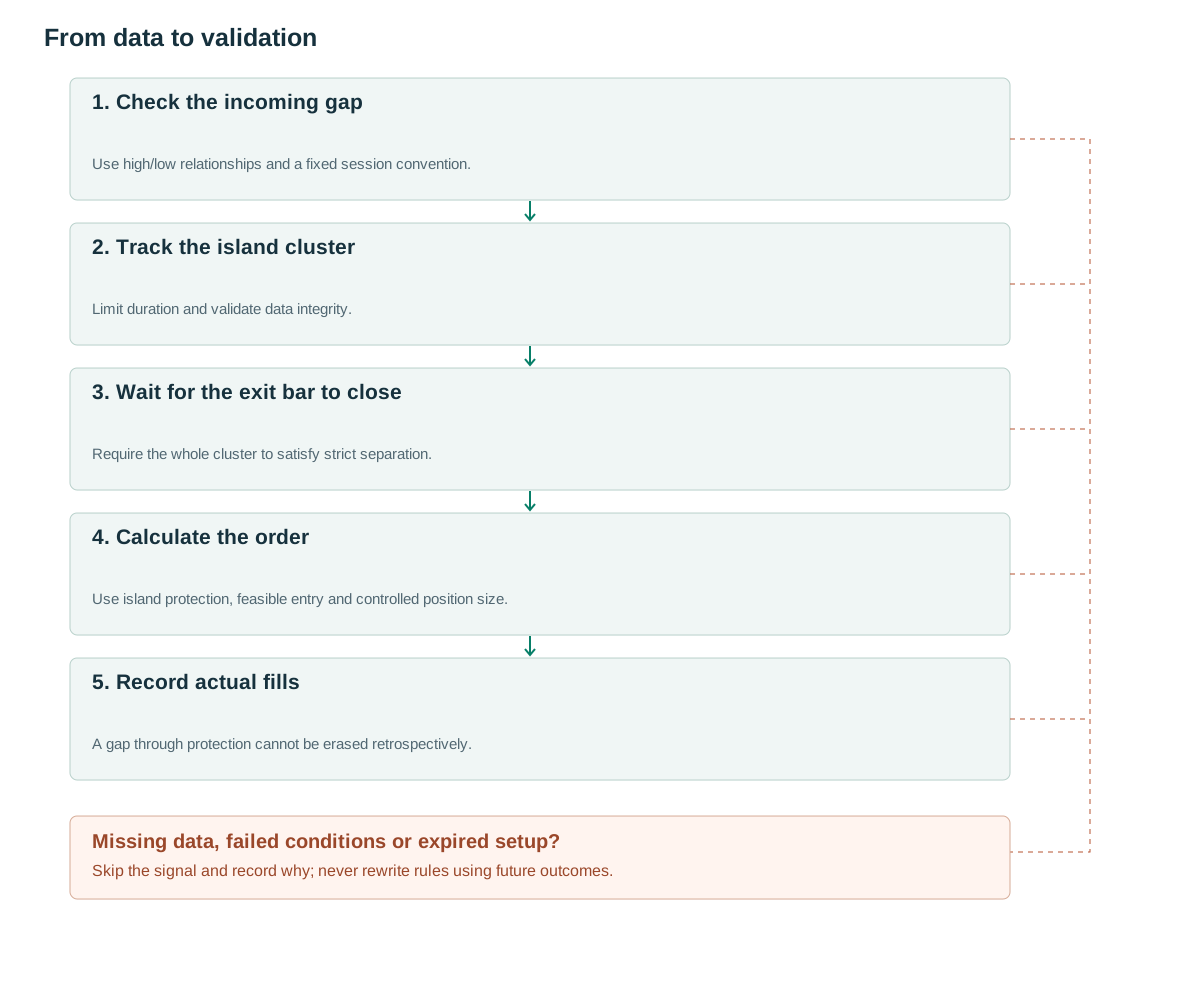
- Check the incoming gapUse high/low relationships and a fixed session convention.
- Track the island clusterLimit duration and validate data integrity.
- Wait for the exit bar to closeRequire the whole cluster to satisfy strict separation.
- Calculate the orderUse island protection, feasible entry and controlled position size.
- Record actual fillsA gap through protection cannot be erased retrospectively.
What the structure tells us
Arthur Hill’s original chart commentary illustrates an island reversal through gaps around a price region. [1] A historical case helps explain the geometry, but does not estimate average profitability across all island reversals.
A bottom island follows a decline: price gaps down, trades in a lower cluster and then gaps upward, leaving the cluster separated. A top island reverses those relationships. In continuously traded markets, natural session gaps may be uncommon; missing bars or changes of contract can create misleading gaps on a chart.
The data convention is therefore part of the detector. A gap on regular-session bars may disappear when extended hours are included. Neither convention is inherently the only possible research choice, but the series definition must be fixed before candidate detection and kept consistent across the sample.
Rules using information already available
Proposed bottom-island definition: the island consists of bars a through b, lasting 1–20 bars. The incoming gap requires H[a]<L[a−1]−epsilon. The outgoing gap requires L[b+1]>H[b]+epsilon. A stricter version also requires max(H[a..b])<min(L[a−1],L[b+1])−epsilon, ensuring that the entire cluster is below both adjacent trading regions.
Set epsilon=max(2 ticks,0.15A), where A=ATR(14) frozen before bar a. These buffers and duration limits are research settings. Validate split adjustments, session calendars, expiry rolls, timestamps and missing observations. A genuine gap does not itself prove that new information is favorable.
Confirm only after bar b+1 has closed, because its eventual low can change throughout the session. Entering at the opening price of b+1 is a different intrabar strategy and needs sufficiently detailed data. Any pivots used by a trend filter must respect their confirmation delay. [2]
A one-bar island is allowed, but should be grouped separately from a multi-bar cluster. The strict separation condition tests the entire cluster, not just the last island bar. This prevents a high earlier in the island from overlapping the exit region while an adjacent-bar-only check incorrectly labels the whole structure isolated.
before potential island: freeze ATR A and session convention
if H[a]<L[a-1]-epsilon:
  track island for at most 20 bars
  on close of candidate exit bar j:
    b=j-1
    if L[j]>H[b]+epsilon and max(H[a:b])<min(L[a-1],L[j])-epsilon:
      signal LONG_ISLAND; stop=min(L[a:b])-epsilon
      execute at next feasible event
# H[a:b] includes both a and b in this pseudocode.
# Top islands reverse high/low relationships and comparisons.
Giving volume a specific job
Higher volume on the exit gap can be tested as a confirmation feature against comparable sessions. A proposed threshold is RVOL≥1.5 relative to the median of the preceding 20 sessions, excluding the current session from the denominator. Analyze one-bar and multi-bar islands separately.
If a company event caused the gap, elevated activity may reflect that event rather than the island structure. Save event labels only when their publication timing is known, then examine the groups separately. Do not use news published after the trade to explain away and remove losing examples.
For intraday variants, specify whether a gap means no reported trades between adjacent bar ranges or merely a session opening discontinuity. Volume from an incomplete exit bar cannot be treated as its final volume. A real-time version requires cumulative activity and a matching historical baseline.
Numerical examples and failure cases
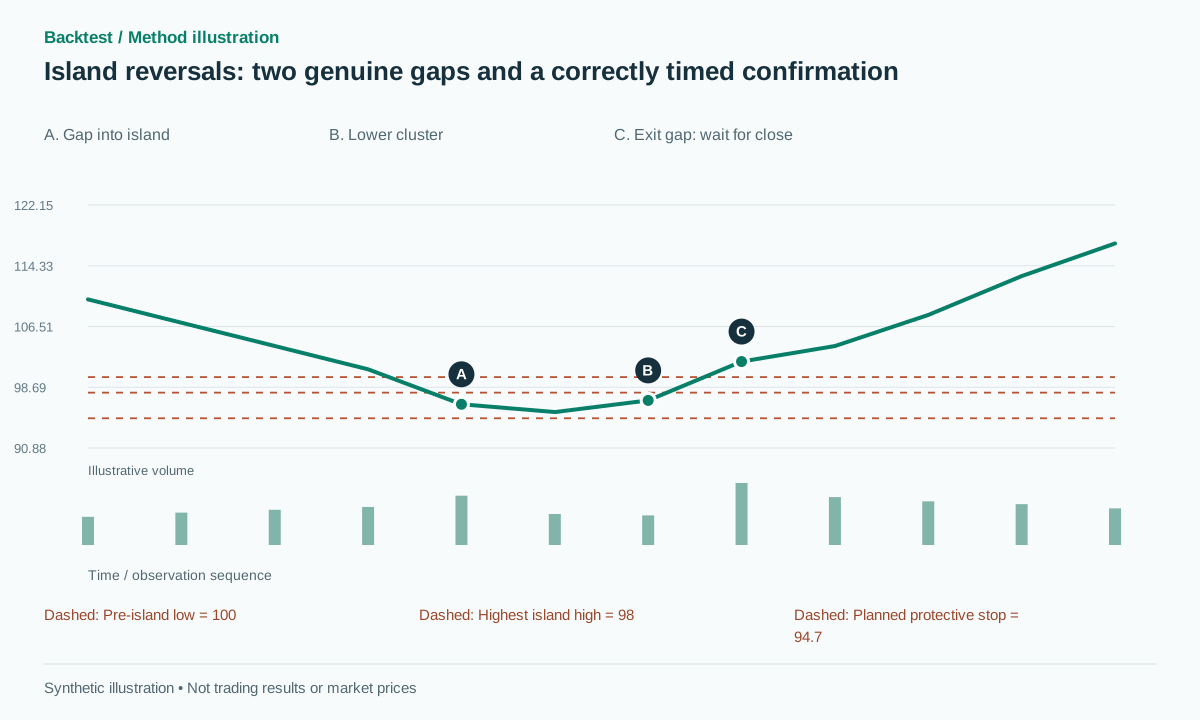
Synthetic example: the bar before the island has low=100. The first island bar has high=97.5; the three-bar cluster has highest high=98 and lowest low=95. The exit-gap bar has low=100.5 and close=102. With A=2 and epsilon=0.3, strict separation passes because 98<min(100,100.5)−0.3=99.7. A feasible next-session entry at 102.2 has protection at 94.7 and, under the proposed 2R exit, target at 117.2.
Recognition failure: the exit session opens at 101 but later trades down to 97.8. By its close, the gap no longer separates the cluster, so the close-confirmed version produces no signal. Trading failure: after entry at 102.2, price gaps lower and the 94.7 protective stop can only fill at 93.8. Loss is 8.4 per unit, exceeding planned risk of 7.5. The backtest must preserve that slippage.
A successful synthetic path reaches 117.2 before the stop. That example illustrates the accounting of the stated exit, not the historical likelihood of success. A line joining closes can show the broad shape but cannot verify either gap; the OHLC relationships above remain the authoritative test.
Entry, invalidation and exits
The baseline places protection outside the entire island and sets a 2R target from the actual entry, with R=entry−stop for a bottom island. A target at earlier resistance is a separate version whose level must be known before entry. A large exit gap can leave a distant stop, requiring smaller size or rejection under a declared pre-submission risk rule.
An additional exit may be triggered when the outgoing gap fills: for a bottom island, price returns to the last island high H[b]. Specify whether this means an intrabar touch or a closing condition. It is a different exit from protection below the full island. The continued existence of the larger pattern cannot justify ignoring a protective order that has already filled.
Do not cancel a resting order retrospectively after seeing an unfavorable gap. A risk limit assessed only after a fill may require reduction or exit at the next feasible event, but its loss and costs remain real in the simulation. For OHLC-only data, disclose any conservative rule used when multiple levels can be reached within one bar.
Testing incremental value
Use all upward gaps after declines as the control, without requiring a preceding downward gap. This isolates whether the island relationship adds information beyond the gap effect itself. Separate single-bar islands, longer clusters, event-driven cases and session discontinuities, and report exclusions for unreliable data.
Evaluate execution using actual available opening prices, spread and gap slippage at protection, not only close-to-close returns. Adjustments can alter historical gap relationships, so preserve the data version and review corporate actions. No new backtest establishes an edge for this configuration; [3] does not validate island-reversal profitability.
Useful tests include overlapping bar ranges despite different closes, an exit gap that disappears before the close, a cluster with an earlier high violating strict separation, a split-induced gap and a missing-session gap. Replay the detector with bars arriving sequentially. It must never publish a close-confirmed signal at the exit session’s open using the low that becomes known only later.
Common pitfalls
Calling a close difference a gap
Adjacent bars with overlapping ranges do not satisfy this definition.
Entering at the open using the eventual daily low
That mixes incompatible timing and introduces future information.
Removing a trade because its stop gaps
An active order and its actual fill must remain in the record.
Checklist before using this method
Check each item after verifying it on your data. Progress is saved in this browser; it does not certify a profitable strategy.
Frequently asked questions
Can an island reversal appear in crypto?
It may appear in a particular feed, but continuous trading and missing observations must be checked. A jump on a chart is not automatically a market gap.
Must the island contain several bars?
No. This version allows a single bar, but reports it separately because timing and context can differ from a longer cluster.
Research sources
Each source supports the definition or evidence described beside it. The pseudocode, synthetic examples and proposed parameters require separate validation.
- Arthur Hill: An Island Reversal for DIAStockCharts / Arthur Hill. Original chart commentary illustrating gaps and an island region; not a win-rate study. Checked: .
- TradingView: RepaintingTradingView. Confirmation timing and repainting concerns for supporting features. Checked: .
- Lo, Mamaysky, Wang: Foundations of Technical AnalysisNBER / Columbia University. Background on systematic pattern research; this configuration is not tested by the paper. Checked: .
Related methods
Risk note
This content supports education and research design, not financial advice. Backtest is historical simulation, does not guarantee future performance and does not place real trades. Methods in this library are not automatically features available in the app. See methodology and learning center.
Validate rules before risking real capital
Check app support, data and individual simulated trades; advanced detectors may require a separate implementation.
Download Backtest on the App Store