Article contents
Evidence and scope
The author’s indexed identification material was read; direct retrieval returned HTTP 403. Its geometry is used for terminology, while the detector and numerical settings below are original proposals. The author’s perfect-trade statistics are not treated as live strategy returns. No new backtest has been run.
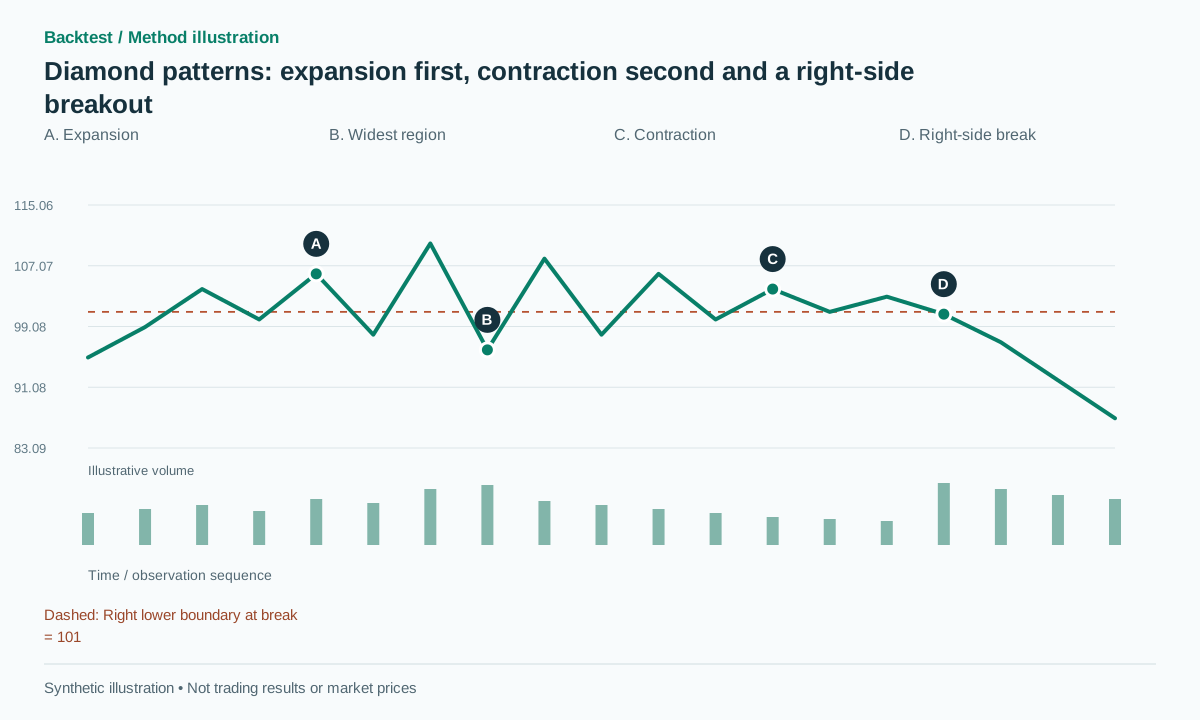 Open full-size illustration
Practical workflow
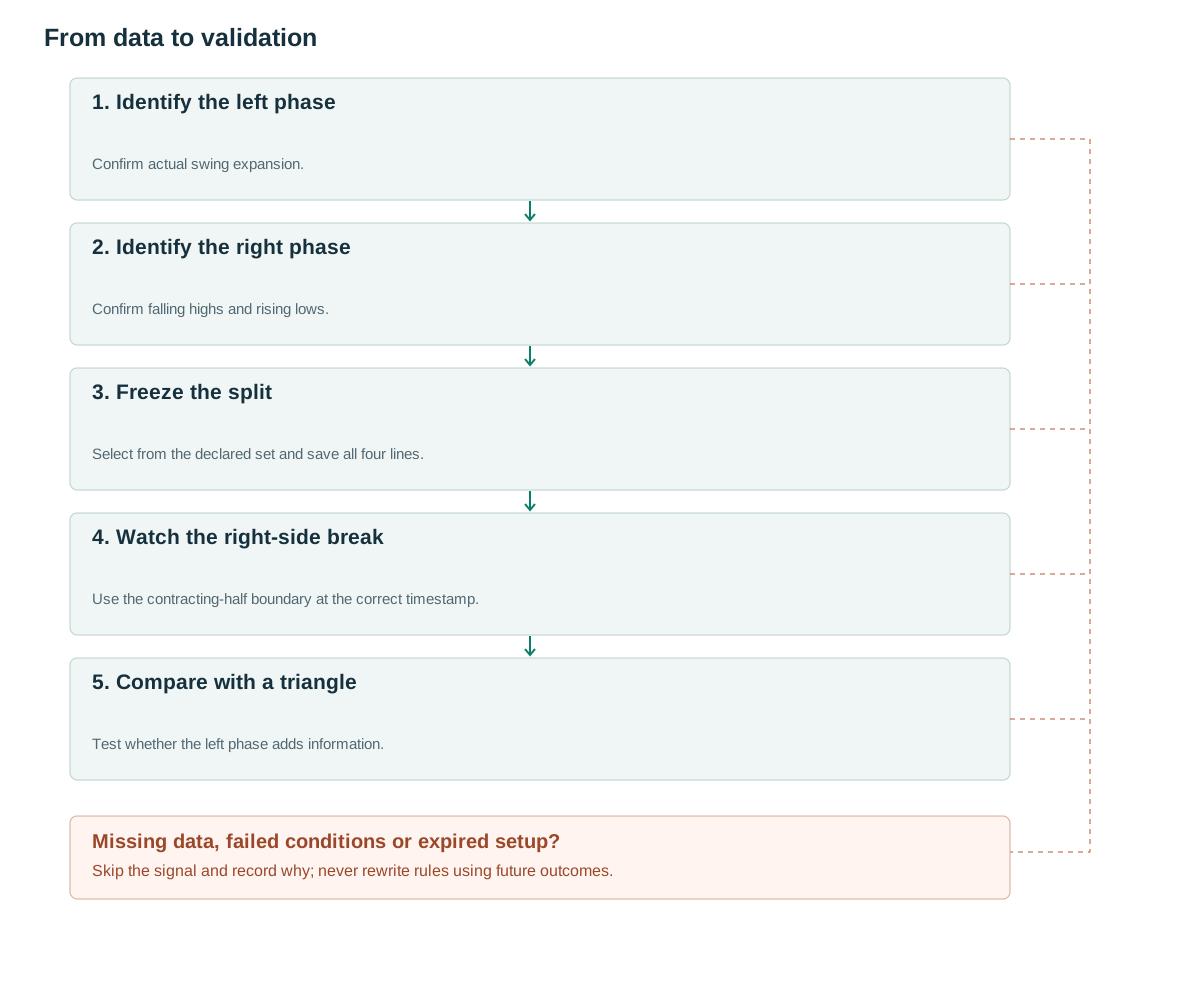
- Identify the left phaseConfirm actual swing expansion.
- Identify the right phaseConfirm falling highs and rising lows.
- Freeze the splitSelect from the declared set and save all four lines.
- Watch the right-side breakUse the contracting-half boundary at the correct timestamp.
- Compare with a triangleTest whether the left phase adds information.
What the structure tells us
Bulkowski describes an initial sequence of higher peaks and lower valleys followed by lower peaks and higher valleys. Real examples need not be perfectly symmetrical. [1] The central requirement is a transition from expansion to contraction, not an attractive outline alone.
Diamond bottom describes a formation entered from a declining trend; diamond top describes entry from a rising trend. The breakout direction still needs to be observed. The proposed quantitative detector is stricter than a visual description, so reduced coverage is a cost to disclose rather than a reason to loosen rules after seeing outcomes.
A diamond can overlap with a broadening formation on the left, a triangle on the right, or another reversal label across the full region. Use a common opportunity identifier when these detectors overlap. Multiple names do not create independent evidence or several separate market moves.
Rules using information already available
Proposed settings: at least eight alternating pivots, confirmed with three bars on each side. Divide the completed window at m between 30% and 70% of its duration, testing only a small preregistered set of split points. Fit left boundaries UL,BL and right boundaries UR,BR. Each side needs at least two anchors, with central anchors allowed to support both halves.
The left side requires slope(UL)>0 and slope(BL)<0; the right requires slope(UR)<0 and slope(BR)>0. Middle width must be at least 1.3 times both starting and ending widths. Define D=max(high)−min(low) across the formation and require D≥1.5A, where A=ATR(14) at creation. Limit anchor residuals to max(0.3A,0.1D). These are research thresholds.
Choose the valid split with the lowest residual within the declared set, then freeze all four lines. For overlapping windows, retain the earliest qualifying candidate under this baseline. Seek only a later break of the right-side boundaries. Expire before UR and BR intersect or after half the formation duration, whichever comes first. Pivots have a confirmation delay. [2]
The split search itself is part of the model. Record how many windows and split points were considered, not just the winning fit. A detector with many hidden attempts can appear precise while selecting noise. The same split-selection rule must run during historical replay and forward evaluation.
when >=8 confirmed alternating pivots exist:
  for m in preregistered_split_candidates:
    fit UL,BL,UR,BR; score geometry on past anchors
  choose valid minimum-residual split; freeze all lines,D,A
for later close t before expiry:
  if C[t-1]<=UR(t-1)+b and C[t]>UR(t)+b:
    signal LONG; stop=last_low-epsilon; target=UR(t)+D
  elif C[t-1]>=BR(t-1)-b and C[t]<BR(t)-b:
    signal SHORT; stop=last_high+epsilon; target=BR(t)-D
# b=max(2 ticks,0.10A), epsilon=max(2 ticks,0.15A).
Giving volume a specific job
Compare activity in the expanding half with activity in the contracting half, and measure RVOL at breakout. There is no requirement that the volume plot itself resemble a diamond. Use median activity per bar because the two phases may have different durations.
One proposed filter requires right-half volume divided by left-half volume below 0.8 and breakout RVOL≥1.5. Preserve the unfiltered version. A rare geometric pattern combined with several filters can leave too few trades for a useful estimate.
Do not use the source’s performance tables to choose a volume threshold on the same sample and call the result independent validation. In a new dataset, retain continuous phase ratios and event labels so that volume contraction can be distinguished from a predictable session lull or the aftermath of one news spike.
Numerical examples and failure cases
Synthetic example: initial width is 4, middle width 14 and final width 3; D=14 and A=2. The left lines diverge and the right lines converge. With b=0.2, suppose the right lower boundary is 101 after activation and price closes at 100.7. A feasible short at 100.6, stop above the last right-side high at 104.3 and target at 87 give risk of 3.7 and reward of 13.6, about 3.68R before costs.
Recognition failure: the left portion contains only one upper spike while lows do not fall. It lacks a genuine expanding phase and is rejected. Trading failure: a valid short later rebounds to 104.4 and reaches the stop. If an upward break happens first, the two-sided version records a long; it does not discard the formation because it was called a diamond top.
A successful synthetic path can reach 87, but that endpoint is only an illustration of the frozen height projection. The apparent large R multiple comes partly from protection near the final narrow region. Its practical value depends on stop-out frequency and trading costs, not just the distance to the target.
Entry, invalidation and exits
Place protection beyond the last confirmed opposite pivot in the right half. Project the entire height D from the right boundary at breakout. A stop outside the whole diamond is generally farther away and requires separate results. Do not use a left-side boundary as the trigger after price has entered the contracting half.
Enter after close confirmation, using an available executable quote. Check that the stop is on the correct side and that costs are reasonable relative to its distance. If a bar can touch both stop and target, use finer observations or a preregistered conservative policy rather than assuming favorable ordering.
The four-line fit must remain immutable for the trade. Later swings can form a new candidate, but cannot relocate the split or the right edge of an earlier one. A retest entry is another strategy with a waiting period and reaction trigger; it cannot be selected retrospectively whenever it produces a better fill.
Testing incremental value
The most informative control is a symmetrical triangle fitted only to the right half. This asks whether the expanding left portion adds useful information or merely a more elaborate name. Limit the number of split points and windows and record the full search effort.
The source’s pattern research follows its own definitions, and does not validate this algorithm. Perfect-trade statistics are not equivalent to the win rate of a funded portfolio after costs. Out-of-sample analysis should report rarity, uncertainty and sensitivity to split placement. [3] supplies general methodological context.
Tests should include genuine two-phase geometry, a broadening-only window, a triangle-only window, a central outlier and a split lying outside the allowed interval. Timing tests should reject breaks that occur before the final anchors become available. Mirror tests should preserve OHLC consistency, while replay tests must confirm that adding later data cannot change an earlier split, height or published signal.
Common pitfalls
Drawing four lines around any range
Without split and residual rules, almost any noisy region can be labeled a diamond.
Treating diamond top as a mandatory short
Top describes context entering the pattern; both exit directions still need to be recorded.
Strong conclusions from rare examples
A few winning charts cannot estimate stable expectancy. Report uncertainty and sample size.
Checklist before using this method
Check each item after verifying it on your data. Progress is saved in this browser; it does not certify a profitable strategy.
Frequently asked questions
Must a diamond look perfectly balanced?
No. This version permits limited time imbalance while still requiring a genuine shift from divergence to convergence.
Is a diamond just a complicated head-and-shoulders pattern?
Their labels can overlap on one price segment. Use one opportunity identifier and evaluate the conditions separately rather than counting two independent trades.
Research sources
Each source supports the definition or evidence described beside it. The pseudocode, synthetic examples and proposed parameters require separate validation.
- Thomas Bulkowski: Diamond BottomsThePatternSite / Thomas Bulkowski. Identification Guidelines and two-phase geometry read through indexed content; direct retrieval returned 403. Perfect-trade tables are not used. Checked: .
- TradingView: RepaintingTradingView. Pivot confirmation delay and repainting. Checked: .
- Lo, Mamaysky, Wang: Foundations of Technical AnalysisNBER / Columbia University. Background on systematic pattern research; this configuration is not tested by the paper. Checked: .
Related methods
Risk note
This content supports education and research design, not financial advice. Backtest is historical simulation, does not guarantee future performance and does not place real trades. Methods in this library are not automatically features available in the app. See methodology and learning center.
Validate rules before risking real capital
Check app support, data and individual simulated trades; advanced detectors may require a separate implementation.
Download Backtest on the App Store