Article contents
Evidence and scope
The author’s indexed identification material was read; direct retrieval returned HTTP 403. It supports basic terminology, not a new performance claim. The detector, thresholds, examples and execution rules here are original research proposals. No new backtest has been run.
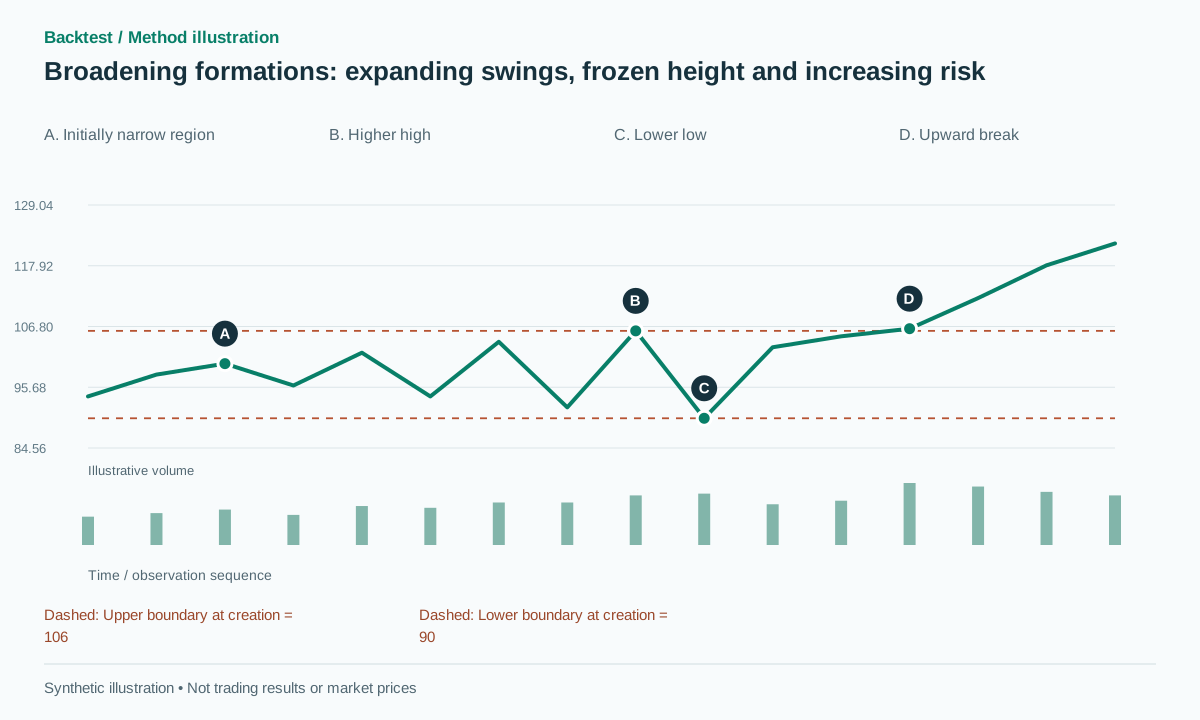 Open full-size illustration
Practical workflow
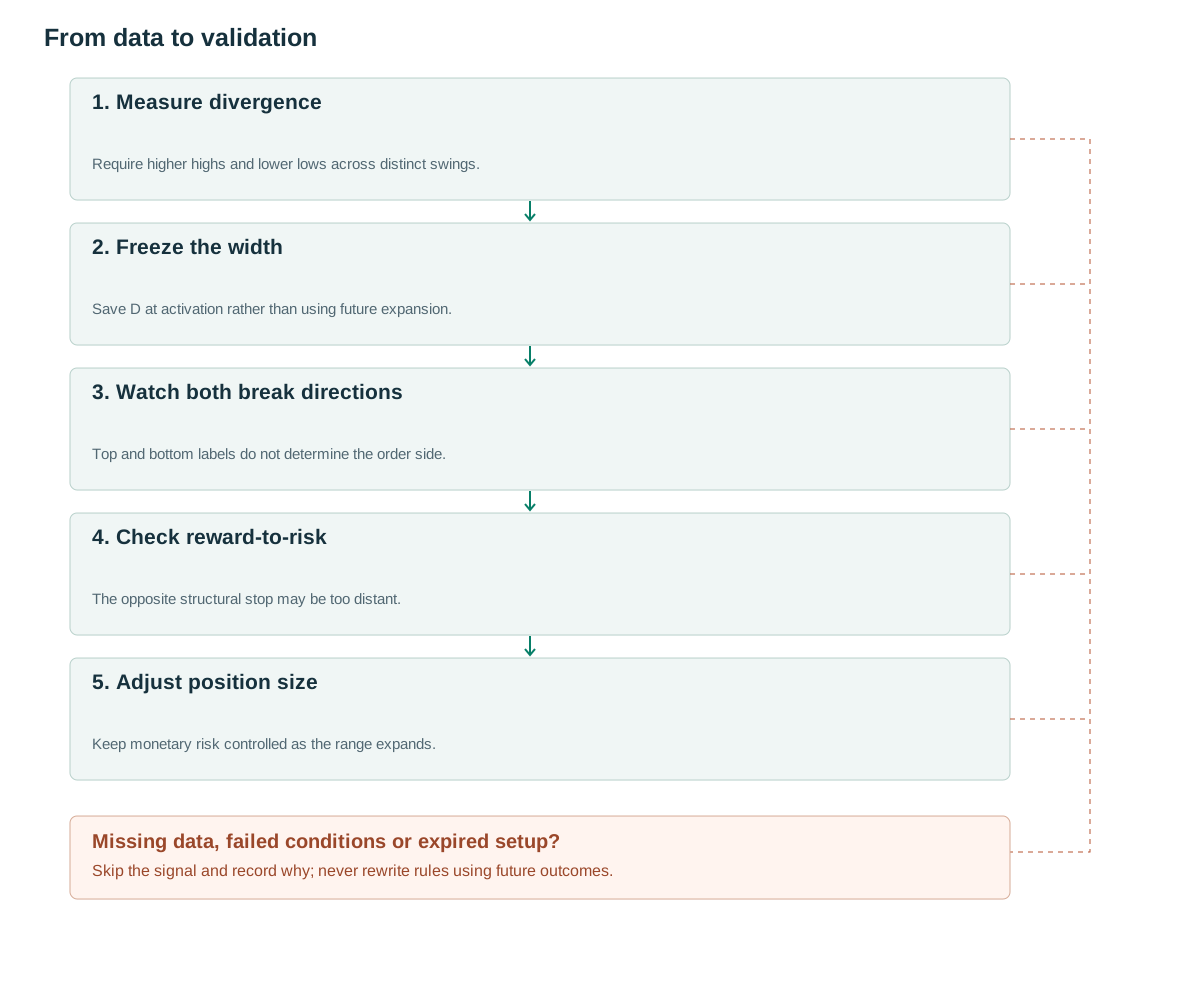
- Measure divergenceRequire higher highs and lower lows across distinct swings.
- Freeze the widthSave D at activation rather than using future expansion.
- Watch both break directionsTop and bottom labels do not determine the order side.
- Check reward-to-riskThe opposite structural stop may be too distant.
- Adjust position sizeKeep monetary risk controlled as the range expands.
What the structure tells us
Bulkowski describes broadening through higher peaks and lower valleys, with possible breaks in either direction. [1] This differs from an expanding wedge whose sides slope the same way and from a contracting triangle.
In this implementation, top or bottom labels describe the trend entering the formation rather than predict its exit. Increasing swing size may reflect greater disagreement or volatility, but OHLC cannot establish the cause. The practical research value is in measuring risk and defining a reproducible boundary-crossing event.
Expansion also changes the economics of a trade. A visually impressive formation may leave the opposite structural extreme so distant that a height projection offers little reward relative to risk. The detector can accept a pattern while the execution layer reasonably declines to trade it. Keep those outcomes separate.
Rules using information already available
Proposed settings: at least five alternating pivots, with two or more points on each side, confirmed with three bars left and right. Fit upper line U(t) and lower line B(t). Let T be duration, D0 initial width and D1 final width. At candidate creation freeze A=ATR(14), epsilon=max(2 ticks,0.15A) and b=max(2 ticks,0.1A). Require D1≥1.3D0 and D1≥1.5A.
Normalize slopes by final width: sU=slope(U)T/D1>0.25 and sB=slope(B)T/D1<−0.25. Successive peaks must rise and successive troughs fall by at least epsilon. Limit anchor residuals to max(2epsilon,0.1D1). Price should actually traverse the region; a single spike should not be enough to make the fitted lines appear to diverge.
Freeze D=D1 and both line coefficients when the candidate exists. Expire after max(5,ceil(T/2)) later bars. Seek a close crossing only after activation. Pivot availability is delayed. [2] Do not extend the boundaries and use their future width to inflate the projected target.
The same-side extreme sequence and fitted-line checks are complementary. Higher highs and lower lows can occur in a disorderly range without a stable geometric envelope. Conversely, regression lines can diverge because of one extreme outlier. Requiring both conditions makes the definition more explicit, while its stricter coverage must be reported.
on confirmed broadening anchors:
  freeze U,B,D=width_at_creation,A,expiry
for each later close t before expiry:
  if C[t-1]<=U(t-1)+b and C[t]>U(t)+b:
    emit LONG; stop=last_low-epsilon; target=U(t)+D
  elif C[t-1]>=B(t-1)-b and C[t]<B(t)-b:
    emit SHORT; stop=last_high+epsilon; target=B(t)-D
  consume candidate at first signal
# Trading reactions between the sides is a separate strategy.
Giving volume a specific job
Expanding price ranges make raw volume comparisons between early and late portions harder to interpret. Instead of assuming higher volume always confirms the formation, retain breakout RVOL and a separate price-displacement-to-activity feature. This baseline does not mandate one ideal volume shape.
A simple experiment compares breaks with RVOL≥1.5 against the unfiltered set under identical exits. Increased activity cannot repair poor reward-to-risk caused by a distant stop. Report formation width relative to ATR and spread to separate geometric effects from execution economics.
Keep volume units consistent and flag event-driven spikes. A high-volume final swing can be a news response rather than a generic property of broadening. If an additional news or session filter is introduced, test it as another feature rather than quietly excluding adverse examples.
Numerical examples and failure cases
Synthetic example: over 30 bars U moves from 100 to 106 and B from 96 to 90. D0=4, D1=16 and the width ratio is 4; sU=0.375 and sB=−0.375. With A=2 and b=0.2, a close at 106.4 confirms a break above a boundary value of 106. A feasible long at 106.5, stop beyond the final low at 89.7 and target at 122 imply risk of 16.8 and reward of 15.5, only 0.92R before costs. The geometry passes, but a proposed minimum of 1.5R rejects the trade.
Failure example: a close at 106.1 does not clear the buffer and price subsequently returns to the lower side. Entering early on a wick at 106.5 belongs to a different intrabar version. If a confirmed breakout order has already filled and later reaches its stop, record the loss rather than adding another swing and treating the old breakout as interior to a larger formation.
A successful synthetic price path may still reach the projected target after the risk filter rejects it. That does not prove the rejection was incorrect: a policy is evaluated over its full opportunity set, not by revising it after one missed winner. Record missed and accepted opportunities separately.
Entry, invalidation and exits
The breakout baseline protects beyond the last confirmed opposite pivot and projects frozen D. Its principal practical limitation is often a wide risk distance. Waiting for a post-break pullback may create a closer stop, but it also misses trades and needs a defined waiting period and reaction trigger.
Trading from the lower side to the upper side is a separate mean-reversion hypothesis. Do not advertise that module’s tighter entry risk as though it belonged to the breakout version. When volatility expands, sizing by a fixed monetary risk budget naturally reduces units. Keeping units unchanged instead increases the money at risk.
Before a new order, evaluate the available quote, costs and portfolio limits. Once a protective order exists, a gap through it requires a feasible fill. A geometric level does not cap loss. If multiple candidate windows overlap, use one event identifier or an explicit combined risk budget to avoid multiplying exposure to the same expanding range.
Testing incremental value
Use a breakout during rising volatility without the broadening geometry as a control. This tests whether diverging pivots add information or simply select high-ATR periods. Group results by width/ATR and executable reward-to-risk, including candidates rejected because protection was too distant.
The source contains statistics under the author’s own measurement conventions; this article does not convert them into a strategy win rate. No new backtest validates these proposed rules. Chronological out-of-sample work must include costs, gaps and duplicate signals; [3] is a methodological reference.
Implementation tests should include a single bad-data spike, a rising parallel channel, a true diverging formation and a break in either direction. Freeze D and confirm that projected widening after activation does not change target distance. Also test the distinction between a crossing during the pivot-confirmation delay and a crossing after the candidate is active.
Common pitfalls
Treating top as an automatic short
The entering trend and the exit direction are separate variables.
Increasing targets with extrapolated width
Future boundary separation can exaggerate reward beyond the observed formation.
Keeping size unchanged as stops widen
A larger stop distance with the same units increases monetary risk.
Checklist before using this method
Check each item after verifying it on your data. Progress is saved in this browser; it does not certify a profitable strategy.
Frequently asked questions
Can trades be taken inside the broadening range?
They can be researched separately, but expanding extremes mean the previous touch is not a reliable fixed limit.
Does broadening prove a liquidity sweep?
No. Crossing earlier extremes is observable; other traders’ stop locations and motives are not established by this shape.
Research sources
Each source supports the definition or evidence described beside it. The pseudocode, synthetic examples and proposed parameters require separate validation.
- Thomas Bulkowski: Broadening TopsThePatternSite / Thomas Bulkowski. Identification Guidelines read through indexed content; direct retrieval returned 403. Performance tables are not used. Checked: .
- TradingView: RepaintingTradingView. Pivot confirmation delay and repainting. Checked: .
- Lo, Mamaysky, Wang: Foundations of Technical AnalysisNBER / Columbia University. Background on systematic pattern research; this configuration is not tested by the paper. Checked: .
Related methods
Risk note
This content supports education and research design, not financial advice. Backtest is historical simulation, does not guarantee future performance and does not place real trades. Methods in this library are not automatically features available in the app. See methodology and learning center.
Validate rules before risking real capital
Check app support, data and individual simulated trades; advanced detectors may require a separate implementation.
Download Backtest on the App Store