Article contents
- Evidence and scope
- Illustration
- Process
- Weaker momentum is not the same as a reversal
- Four variants need explicit anchors and context
- Warm-up and boundary values must be reproducible
- A confirmed divergence can still offer poor entry economics
- Activation, invalidation and overlapping candidates
- Give volume an independently testable role
- Test each divergence family separately
- Common pitfalls
- Practical checklist
- Frequently asked questions
- Research sources
Evidence and scope
Fidelity and TradingView explain RSI and divergence; TA-Lib supplies an implementation for numerical comparison. These references do not establish a win rate or profitability for the configuration proposed here.
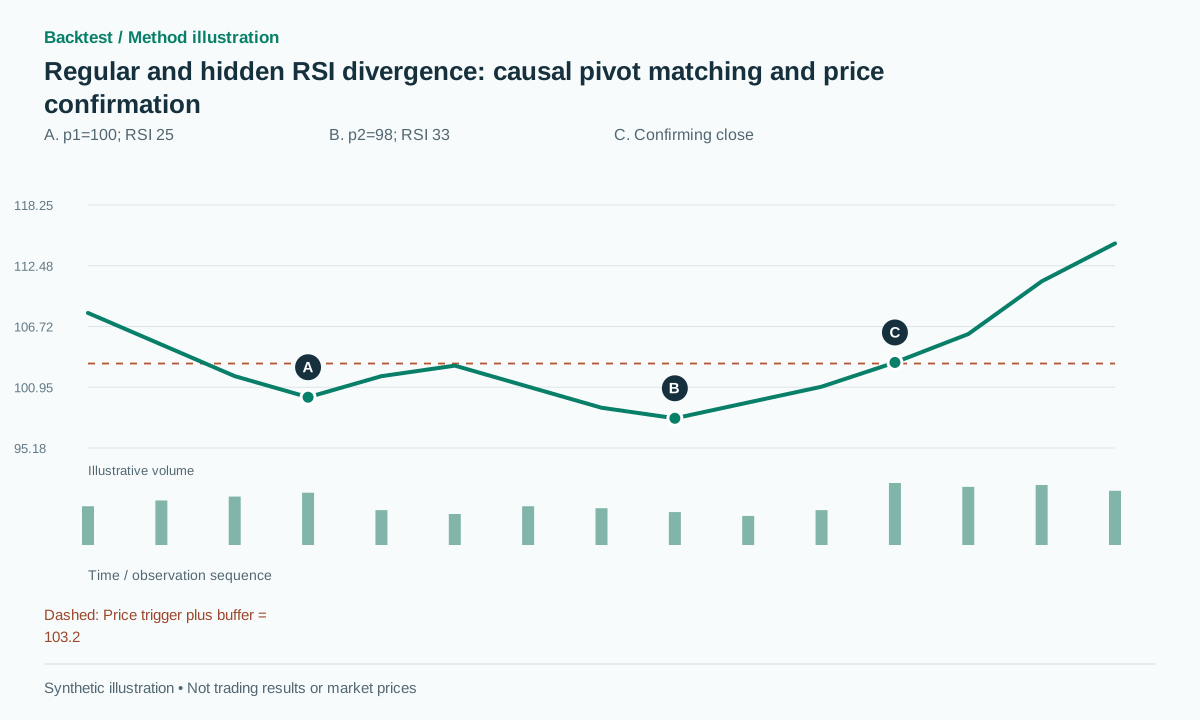 Open full-size illustration
Practical workflow
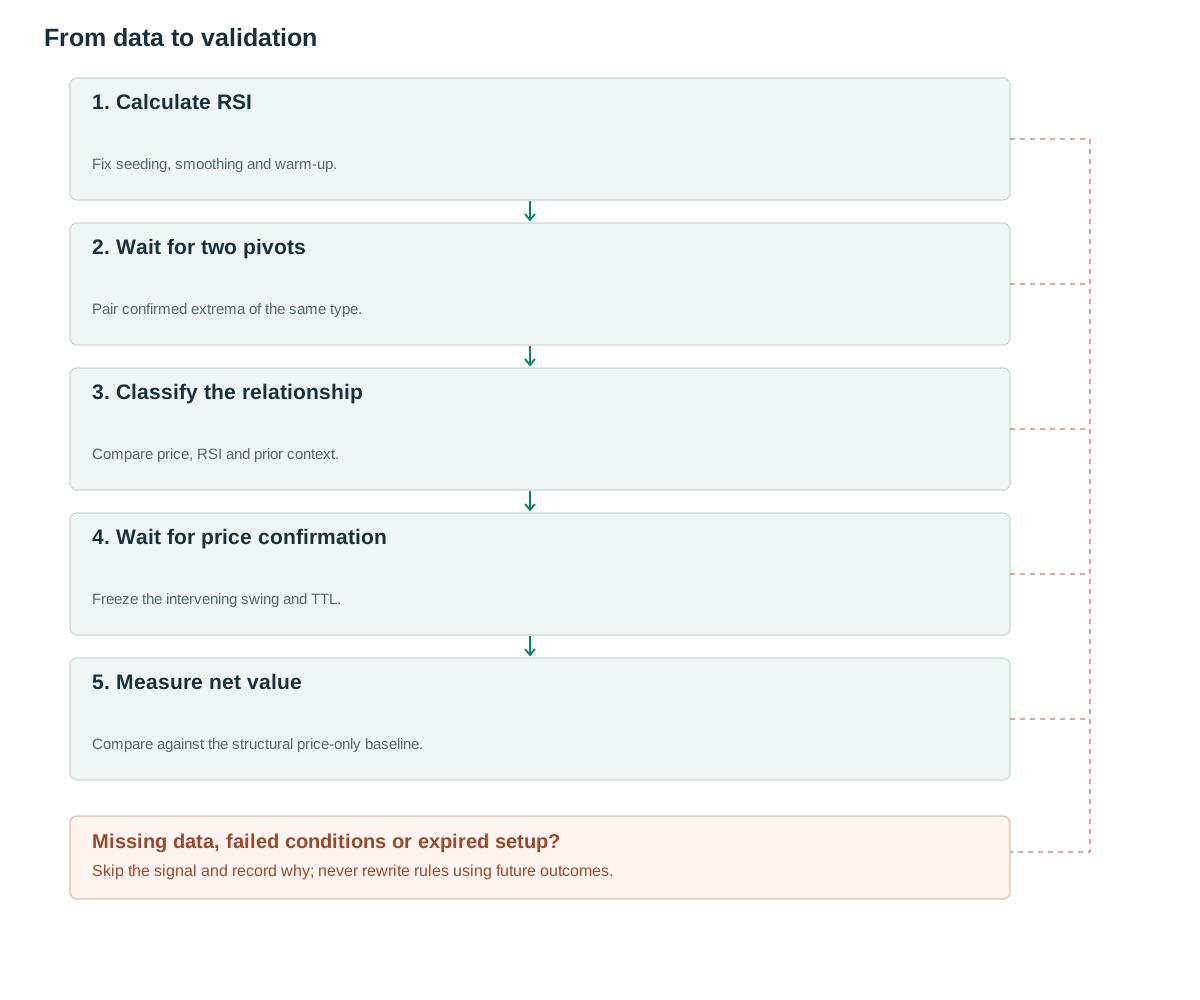
- Calculate RSIFix seeding, smoothing and warm-up.
- Wait for two pivotsPair confirmed extrema of the same type.
- Classify the relationshipCompare price, RSI and prior context.
- Wait for price confirmationFreeze the intervening swing and TTL.
- Measure net valueCompare against the structural price-only baseline.
Weaker momentum is not the same as a reversal
Fidelity notes that RSI can remain extreme during a strong trend [1]. RSI above 70 therefore is not an automatic sell instruction. A higher price high with lower RSI can also precede further gains; several divergence candidates may appear before a sustained reversal, and some trends never reverse within the strategy's horizon.
RSI compares smoothed positive and negative close changes. TradingView documents its RMA-based calculation [2]. The proposed implementation sets gain=max(C[t]−C[t−1],0) and loss=max(C[t−1]−C[t],0), seeds with the mean of 14 changes and updates G=(13G+gain)/14, with the same recursion for L. When G+L>0, RSI=100G/(G+L).
Price and RSI are not independent witnesses: RSI is calculated from price. Divergence may encode a useful difference between an extreme price and the path taken to reach it, but a second label agreeing with a price setup does not automatically double the evidence.
Four variants need explicit anchors and context
The baseline pairs consecutive confirmed price pivots of the same type and samples RSI at each pivot's occurred_at. Evaluate the pair only after the second pivot is confirmed. Do not slide the RSI anchor several bars to the most attractive oscillator extreme. A separate RSI-pivot detector would require a matching window and availability from both detectors.
Proposed tolerances are epsilon=0.1×ATR before the second pivot and d=5 RSI points. Regular bullish divergence requires a lower price low and higher RSI; hidden bullish divergence requires a higher price low and lower RSI within a previously established uptrend. Bearish cases reverse the relevant relationships. Context must already be known before the first anchor.
The magnitude filters prevent tiny numerical differences from becoming divergence labels, but their usefulness must be tested. Record raw price differences, RSI differences and separation in bars so rejected candidates can be analyzed without recomputing a different historical selection.
| Variant | Price at p2 versus p1 | RSI at p2 versus p1 | Proposed prior context |
|---|---|---|---|
| Regular bullish | Lower by more than epsilon | Higher by more than d | A preceding decline |
| Regular bearish | Higher by more than epsilon | Lower by more than d | A preceding advance |
| Hidden bullish | Higher by more than epsilon | Lower by more than d | Confirmed uptrend |
| Hidden bearish | Lower by more than epsilon | Higher by more than d | Confirmed downtrend |
when p2 becomes confirmed:
    p1 = previous_confirmed_pivot_of_same_kind(p2)
    if p1 is None or RSI[p1.i] is missing or RSI[p2.i] is missing: return
    bull_regular = p2.price < p1.price-eps and RSI[p2.i] > RSI[p1.i]+d
    if bull_regular:
        trigger = highest_confirmed_swing_between(p1,p2)
        freeze_candidate(p1,p2,trigger,expires_in=10)
# Evaluate a close crossing only after activation.
# If the trigger was crossed before activation, reject or use a separate late-entry version.
Warm-up and boundary values must be reproducible
TA-Lib's source supports checking seeding and numerical behavior [3], but platform outputs should not be assumed identical without comparison. The proposed flat-series convention sets RSI=50 with a flat flag when G=L=0. If L=0<G, RSI=100; if G=0<L, RSI=0. Test these branches explicitly.
Do not calculate RSI from split-adjusted closes while detecting pivots on unadjusted highs and lows. Missing bars can change both smoothing and pivot position. Store indicator version, seed, lookback, pivot convention and tolerances with the research manifest.
For a numerical fixture, feed a monotonic rising close series, a monotonic declining series and a completely flat series after adequate warm-up. Then insert one gain and one loss and compare the recursive values step by step. A difference in RSI caused by initialization should be resolved before it is interpreted as a disagreement in divergence logic.
A confirmed divergence can still offer poor entry economics
Synthetic example: low p1=100 has RSI=25; low p2=98 has RSI=33. With ATR=2, epsilon=0.2 and the eight-point RSI increase exceeds d=5. Once p2 is confirmed, an already-known intervening swing high at 103 becomes the price trigger. A later close at 103.3 exceeds a buffered trigger of 103.2.
If the next executable entry is 103.4 and the stop is 97.8, initial price risk is 5.6 points. A 2R target is 114.6, quite distant from the original divergence structure. A path reaching 114.6 before the stop would satisfy that synthetic target, but it is not a historical success-rate estimate.
Failure without entry: after p2=98, price continues 97→94 and never crosses 103. The candidate is invalidated or expires. An alternative strategy buying immediately near 98 must retain its own losses; it cannot borrow the results of the version that waits for a structural trigger.
Failure after entry is also possible: the breakout fills, then price returns through the structural low. A detector can correctly identify the two-anchor relationship while the trading hypothesis loses. Report detector validity, trigger validity and realized outcome separately.
Activation, invalidation and overlapping candidates
A proposed TTL is ten bars after confirmation. Before entry, a new low below p2−buffer invalidates a bullish regular candidate. After entry, use the registered stop-market and time-exit rules. A gap that makes a setup uneconomic can justify a pre-submission rejection, but cannot erase an order that has already filled.
Several anchor combinations can express the same underlying idea. The baseline pairs adjacent same-type pivots and creates an event ID from their identities. A three-low divergence is a separate model with more choices, not three independent trades just because three lines can be drawn.
Freeze the intervening structural trigger when the candidate activates. If that level was crossed during the pivot-confirmation delay, explicitly reject the stale setup or register a late-entry version. Updating the trigger to whichever later swing gives a better fill changes the hypothesis and can introduce retrospective selection.
Give volume an independently testable role
One proposed hypothesis is lower activity during the decline toward p2 followed by elevated activity at the price breakout. Compare average volume per bar or same-time RVOL rather than raw totals over legs of unequal duration. Small price displacement with high total volume does not by itself prove absorption.
Use three branches: structural price trigger only, the same trigger plus divergence, and then divergence plus volume. Keep stop, sizing and execution identical. This distinguishes the value of the oscillator relationship from the value of activity and avoids attributing every improvement to the last indicator added.
Inspect transaction costs in the high-volume subset. A filter may select news-driven breakouts with wider spreads or more adverse gaps. Report rejected candidates and opportunity count, not just the win rate among the remaining fills.
Test each divergence family separately
Report regular versus hidden and bullish versus bearish variants separately. Preserve a final time period not used to choose RSI length, pivot window or d. Trying many configurations and publishing only an attractive chart does not establish a repeatable selection process.
Fixtures should verify that p2 can be drawn at an earlier bar while no signal appears before confirmation, and that RSI is sampled at exactly the matched price timestamps. Include flat sequences, inadequate warm-up, overlapping candidates and mirrored bearish data.
Measure candidate count, trigger rate, cancellation rate, waiting time and net return per event as well as portfolio exposure. Stress spreads and stop gaps because post-breakout entries may be materially worse than the signal close. If divergence adds complexity without improving a registered outcome outside development, the structural baseline remains a useful result.
Common pitfalls
Matching points by eye
Selecting the most convenient RSI low near each price low without a fixed window is not reproducible.
Repeated divergence during a trend
Momentum can decelerate while price continues sharply in the same direction.
Mixing hidden and regular variants
Their context hypotheses differ; pooled statistics can conceal opposite behavior.
Checklist before using this method
Check each item after verifying it on your data. Progress is saved in this browser; it does not certify a profitable strategy.
Frequently asked questions
Can divergence identify a bottom before the pivot confirms?
Only by using a provisional candidate that may disappear. This baseline waits for confirmation so its published history remains stable.
Should RSI be replaced with MACD?
Compare incremental information with the same price trigger and execution policy. Switching oscillators for each attractive example does not define a testable system.
Research sources
Each source supports the definition or evidence described beside it. The pseudocode, synthetic examples and proposed parameters require separate validation.
- Relative Strength IndexFidelity. Read divergence and limitations of overbought/oversold interpretations. Checked: .
- Relative Strength IndexTradingView. Read the RMA formula and RSI interpretation. Checked: .
- TA-Lib RSI implementationTA-Lib. Read calculation source code; it is not a profitable trading strategy. Checked: .
Related methods
Risk note
This content supports education and research design, not financial advice. Backtest is historical simulation, does not guarantee future performance and does not place real trades. Methods in this library are not automatically features available in the app. See methodology and learning center.
Validate rules before risking real capital
Check app support, data and individual simulated trades; advanced detectors may require a separate implementation.
Download Backtest on the App Store